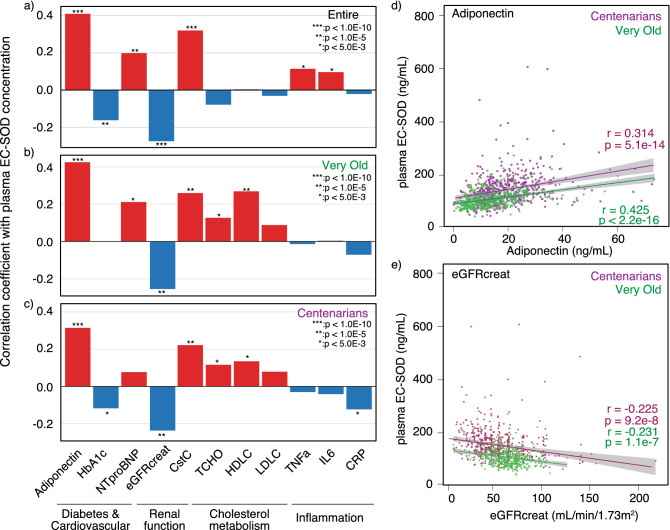
Figure 5.
Correlation analysis of EC-SOD concentration with plasma biomarkers for age-related diseases. The bar charts indicate the correlation coefficient (r) between plasma EC-SOD and the concentrations of 11 plasma biomarkers for the entire cohort (a), the Very Old (b), and Centenarians (c). The red and blue bars indicate positive and negative correlations, respectively. The dot plots indicate the association between EC-SOD and adiponectin concentrations in plasma (d) and eGFRcreat (e) in the Very Old (green) and Centenarians (purple). Lines in the dot plot indicate correlation lines and the gray regions surrounding the correlation lines indicate the area for 95% confidence intervals.

