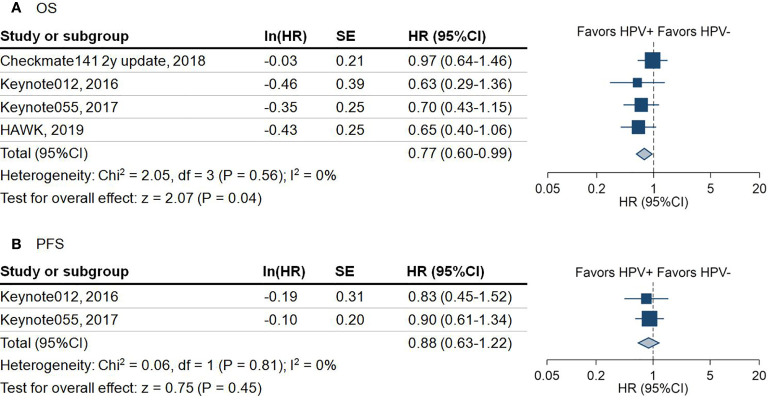
Figure 3.
Forest plot for the survival outcome of anti-programmed death-1/programmed death-ligand 1 agents in patients with different human papillomavirus status. (A) Overall survival (OS) of included studies. Squares indicate adjusted effect size (hazard ratio [HR]). Horizontal lines represent 95% confidence interval (95%CI). Diamonds represent the pooled HRs. (B) Progression-free survival (PFS) of included studies. Squares indicate adjusted effect size (hazard ratio [HR]). Horizontal lines represent 95%CI. Diamonds represent the pooled HRs. Pooled HRs were calculated using the fixed-effect model. PD-1, Programmed death 1; PD-L1, Programmed death-ligand 1; HPV, human papillomavirus; +, positive; -, negative; SE, standard error.

