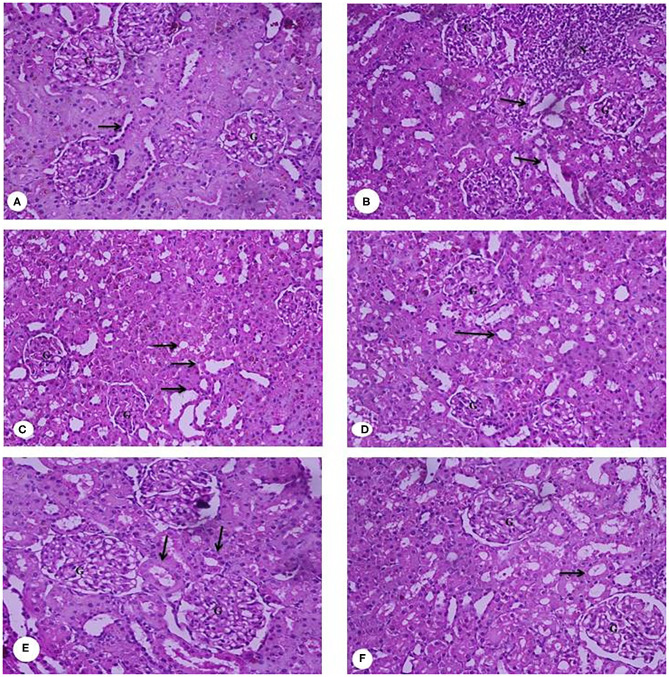
Figure 9.
(A–F) Representative photomicrographs of kidney sections of rats from the different experimental groups (Hematoxylin and eosin stain X 40). (A) G1 Negative control. (B) G2 Positive control group. (C) G3 Fed SFY fortified with free Fe + ascorbic acid. (D) G4 Fed SFY fortified with free Fe + FA + ascorbic acid. (E) G5 Fed SFY fortified with Fe@ BSA-NPs + ascorbic acid. (F) G6 Fed SFY fortified with Fe + FA@ BSA-NPs + ascorbic acid. BSA-NPs, Bovine Serum Albumin nanoparticles; FA, Folic Acid.

