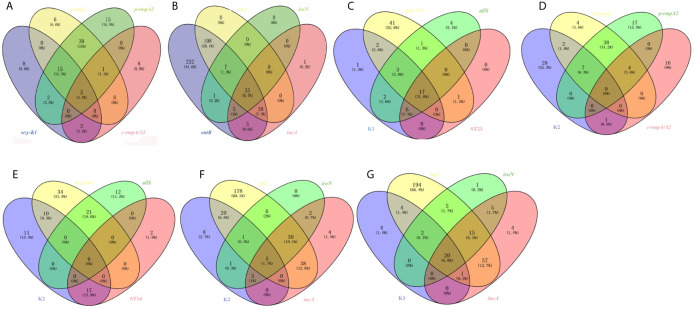
Figure 3.
Venn diagrams of various relationships among virulence genes, serotypes and ST types. (A) Venn diagram of wzy-K1, p-rmpA, p-rmpA2 and c-rmpA/A2. (B) Venn diagram of entB, irp2, iroN and icuA. (C) Venn diagram of K1, peg-344, allS and ST23. (D) Venn diagram of K2, p-rmpA, p-rmpA2 and c-rmpA/A2. (E) Venn diagram of K2, peg-344, allS and ST14. (F) Venn diagram of K2, irp2, iroN and iucA. (G) Venn diagram of K1, irp2, iroN and iucA. Such relationships were shown in 521 K. pneumoniae strains.

