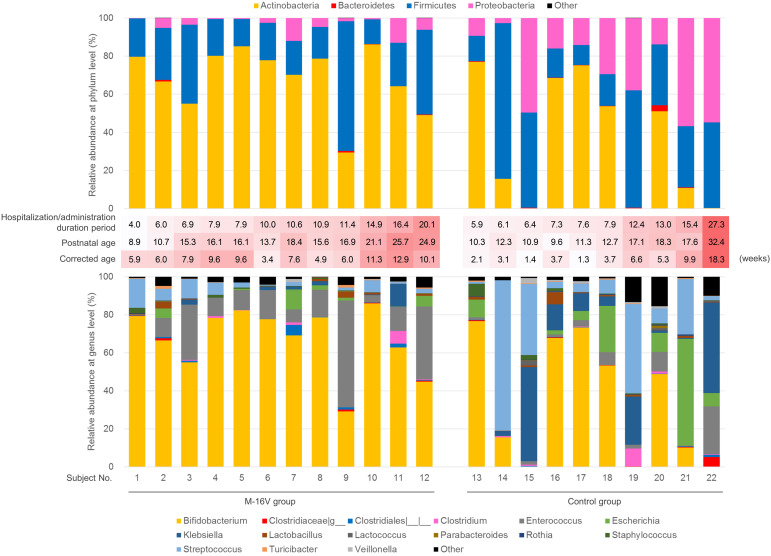
FIGURE 3.
Fecal microbiota composition of each subject. Relative abundance of each phylum (upper) and genus (lower) of microbiota of each subject. The four phyla and 15 genera indicated in Table 2 were shown. In the middle of the figures, hospitalization period (that is, probiotic administration duration in the M-16V group), postnatal and corrected age at the fecal sampling scaled by red color were indicated. The darker the red color, the higher the value of administration duration/hospitalization period, postnatal age, and corrected age, respectively. Subject No. 1–12 were in the M-16V group, and subject No. 13–22 were in the control group.

