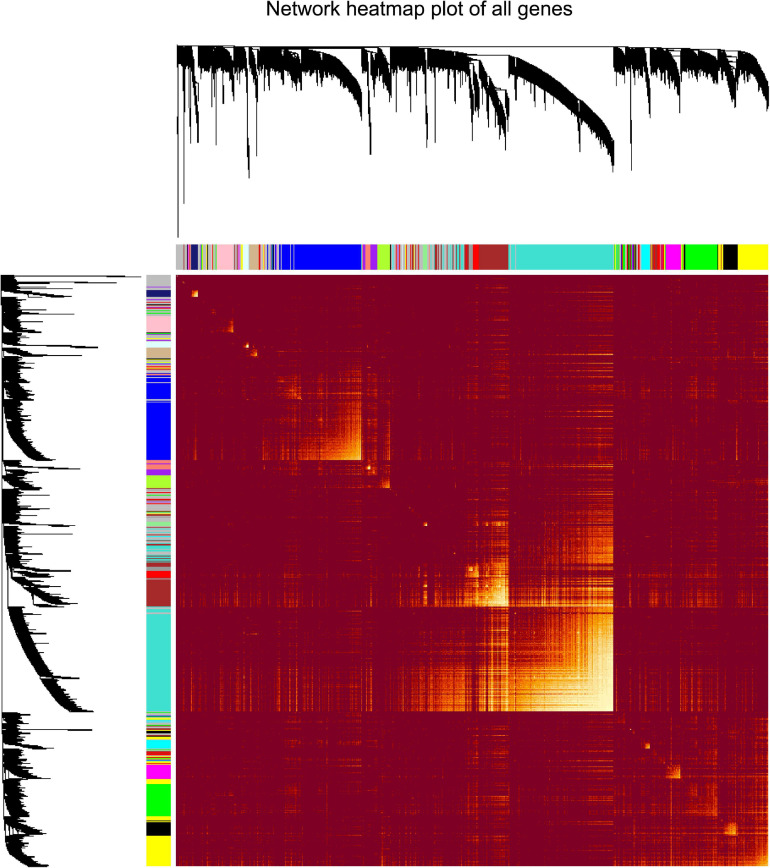
FIGURE 2.
Analysis of co-expressing genes modules. Topological overlap matrix plot of all genes. Genes in the rows and columns are sorted by the clustering tree. Different colors of the horizontal axis and vertical axis represent different modules. The brightness of yellow in the middle represents the degree of connectivity of different modules.

