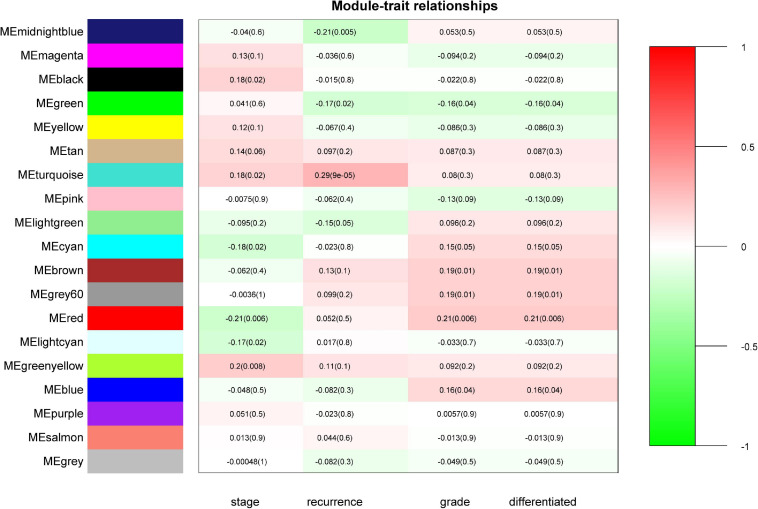
FIGURE 3.
Identification of modules associated with the clinical status of CRC. Heatmap of the correlation between module eigengenes (ME) and clinical traits of CRC. Numbers represent correlation (numbers in brackets are P-values). The turquoise module was most positively correlated with CRC recurrence.

