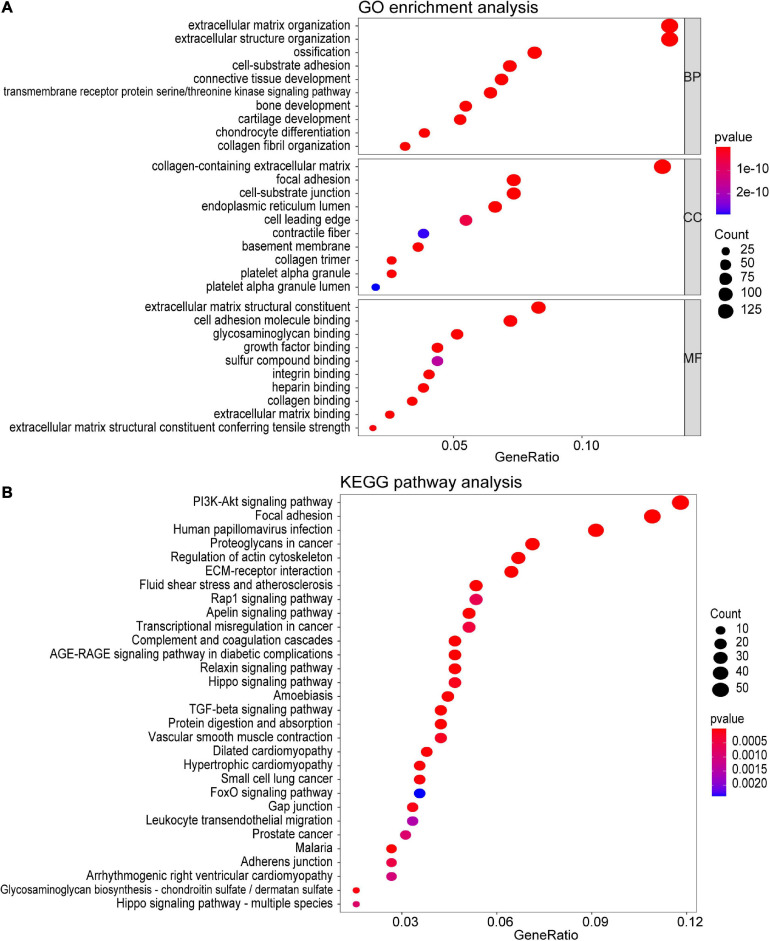
FIGURE 4.
Functional enrichment analysis of all the genes in the turquoise module. (A) GO enrichment analysis for biological process, molecular function, and cellular component. (B) KEGG pathway enrichment analysis. The colored dots represent term enrichment, blue indicates low enrichment, and red indicates high enrichment. The sizes of the dots represent the number of genes in each GO category and KEGG pathways.

