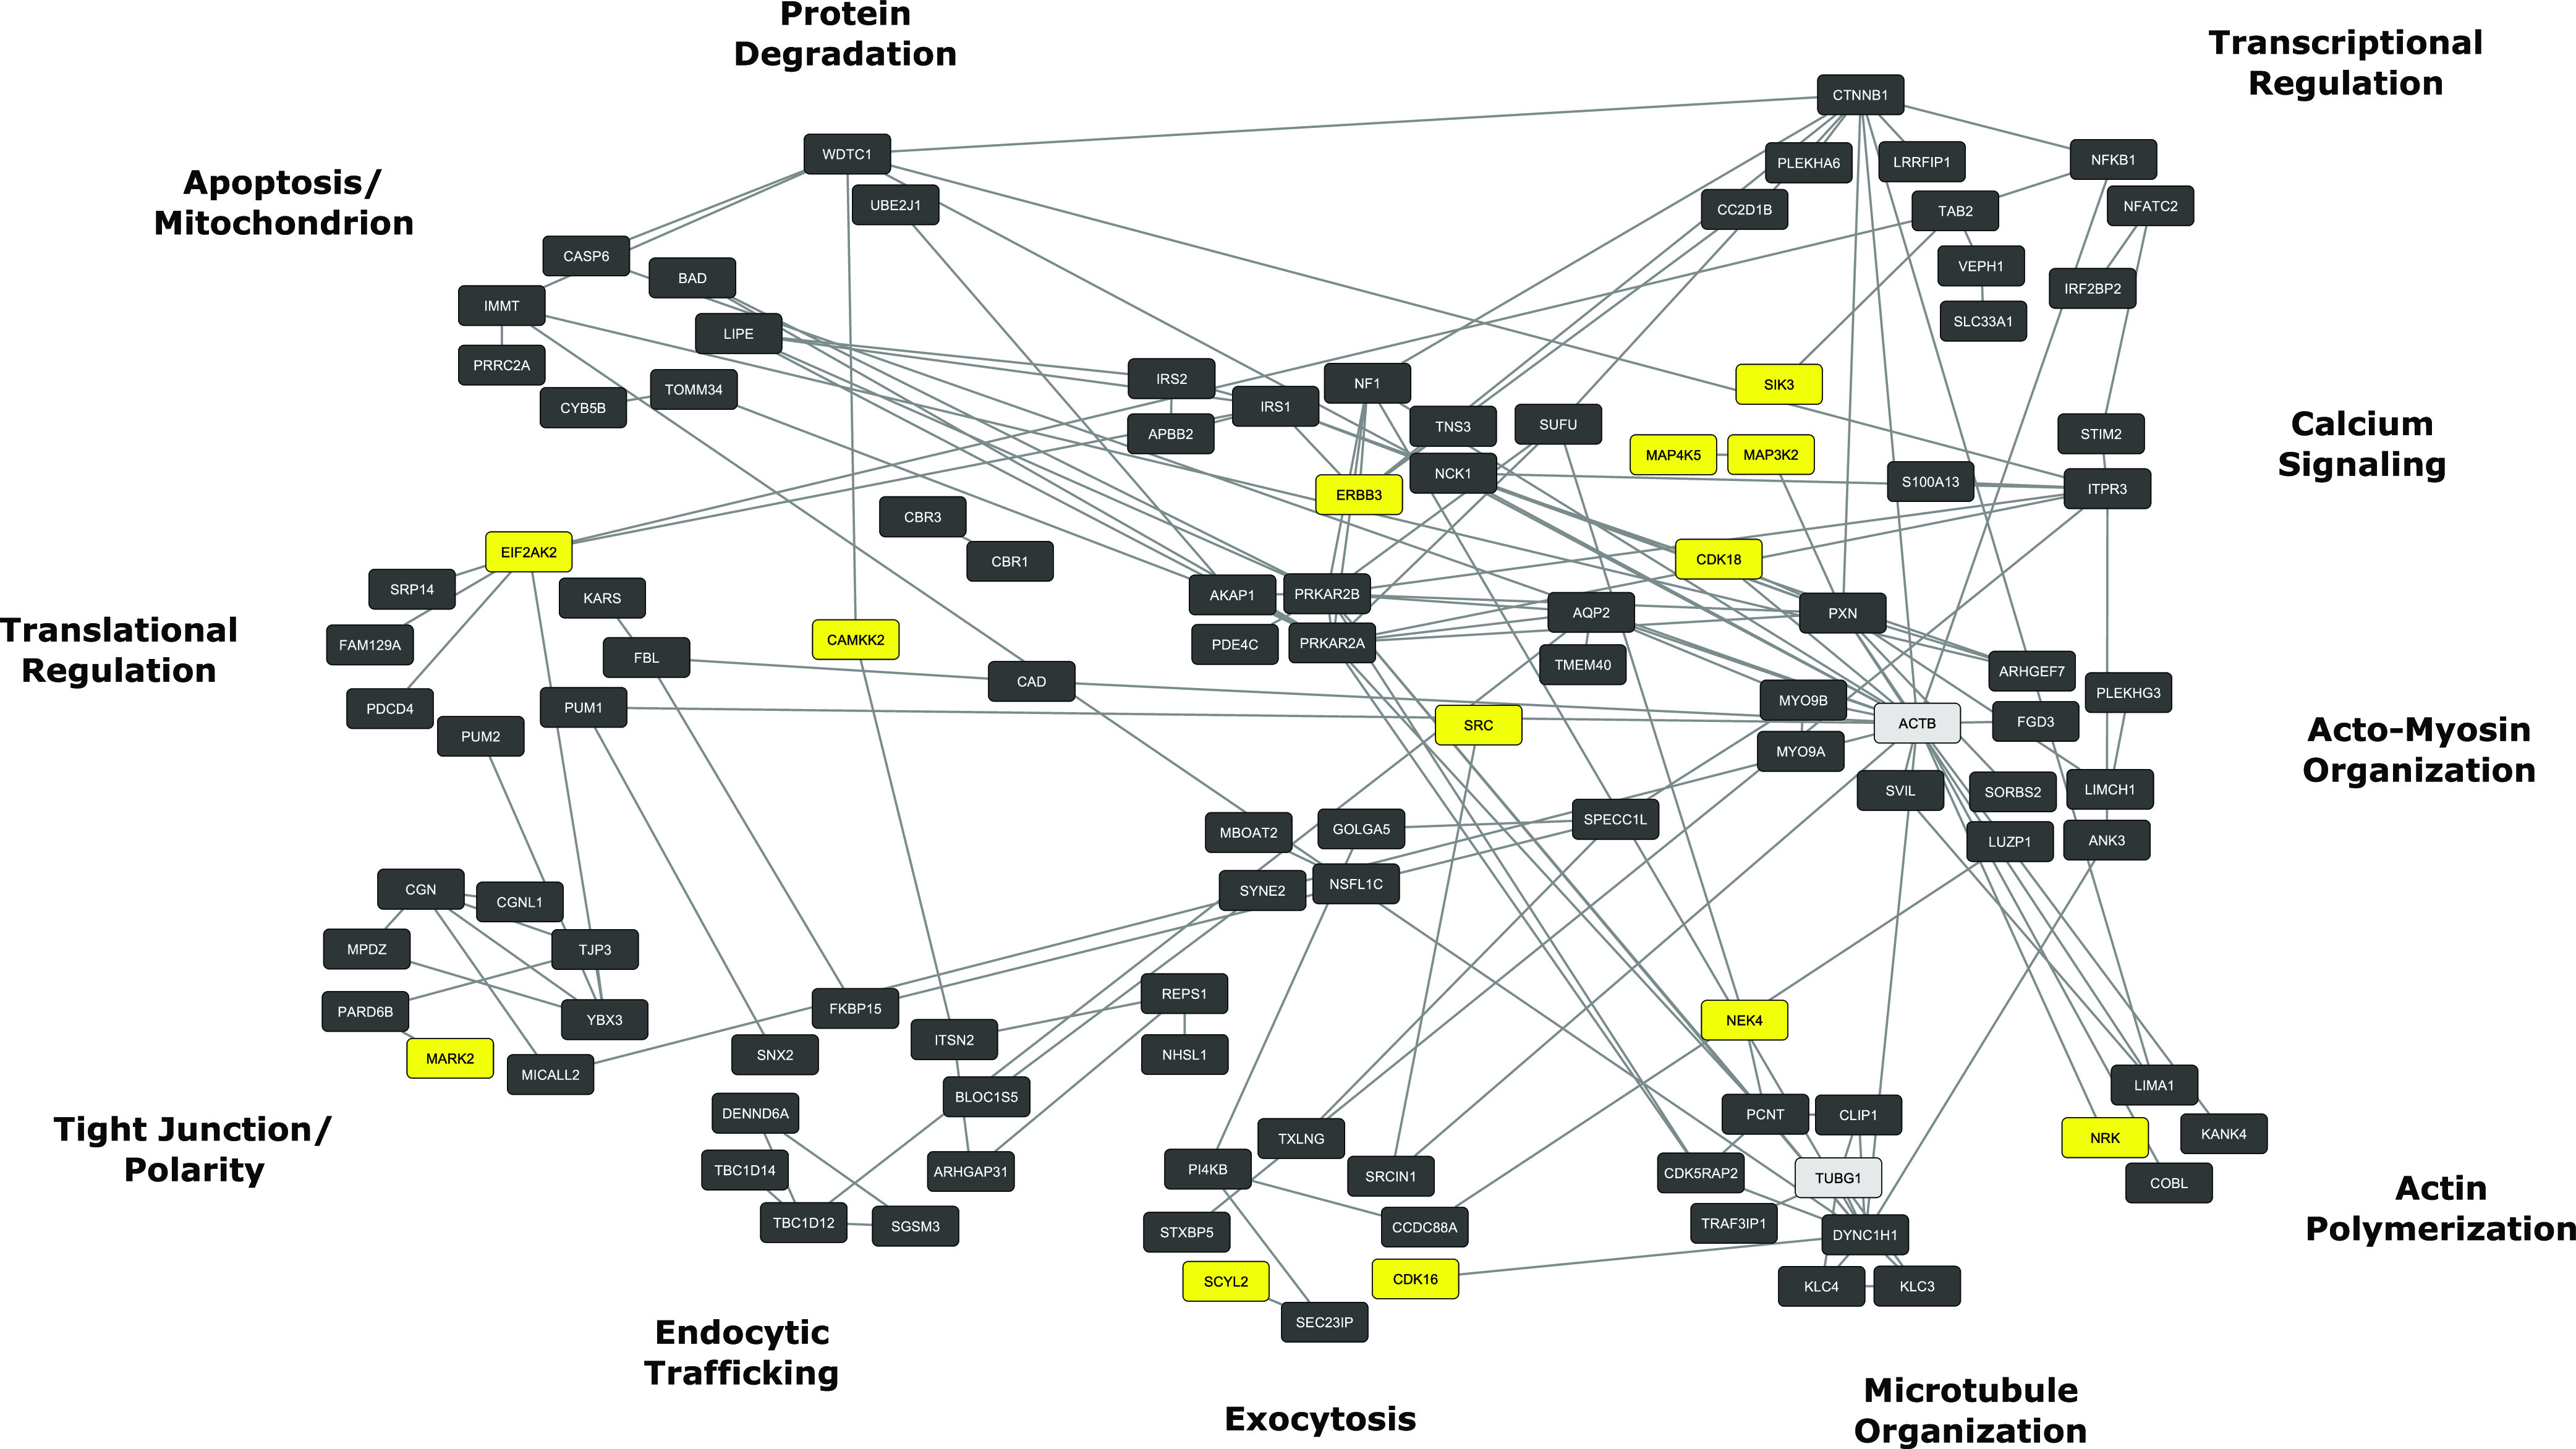
Fig. 4.

PKA signaling network. PKA target phosphoproteins were identified by deletion of PKA by genome editing techniques followed by SILAC-based phosphoproteomics (Isobe et al., 2017). Functional groups around the periphery correspond to vasopressin-regulated processes in Table 1. Yellow nodes indicate other protein kinases that undergo PKA-mediated phosphorylation. Gray nodes indicate non-PKA targets included to consolidate phosphoprotein clustering. Analysis used a computer application called STRING (https://string-db.org/) for initial mapping followed by additional classification by Gene Ontology biologic process terms. Final visualization used Cytoscape (https://cytoscape.org/).
