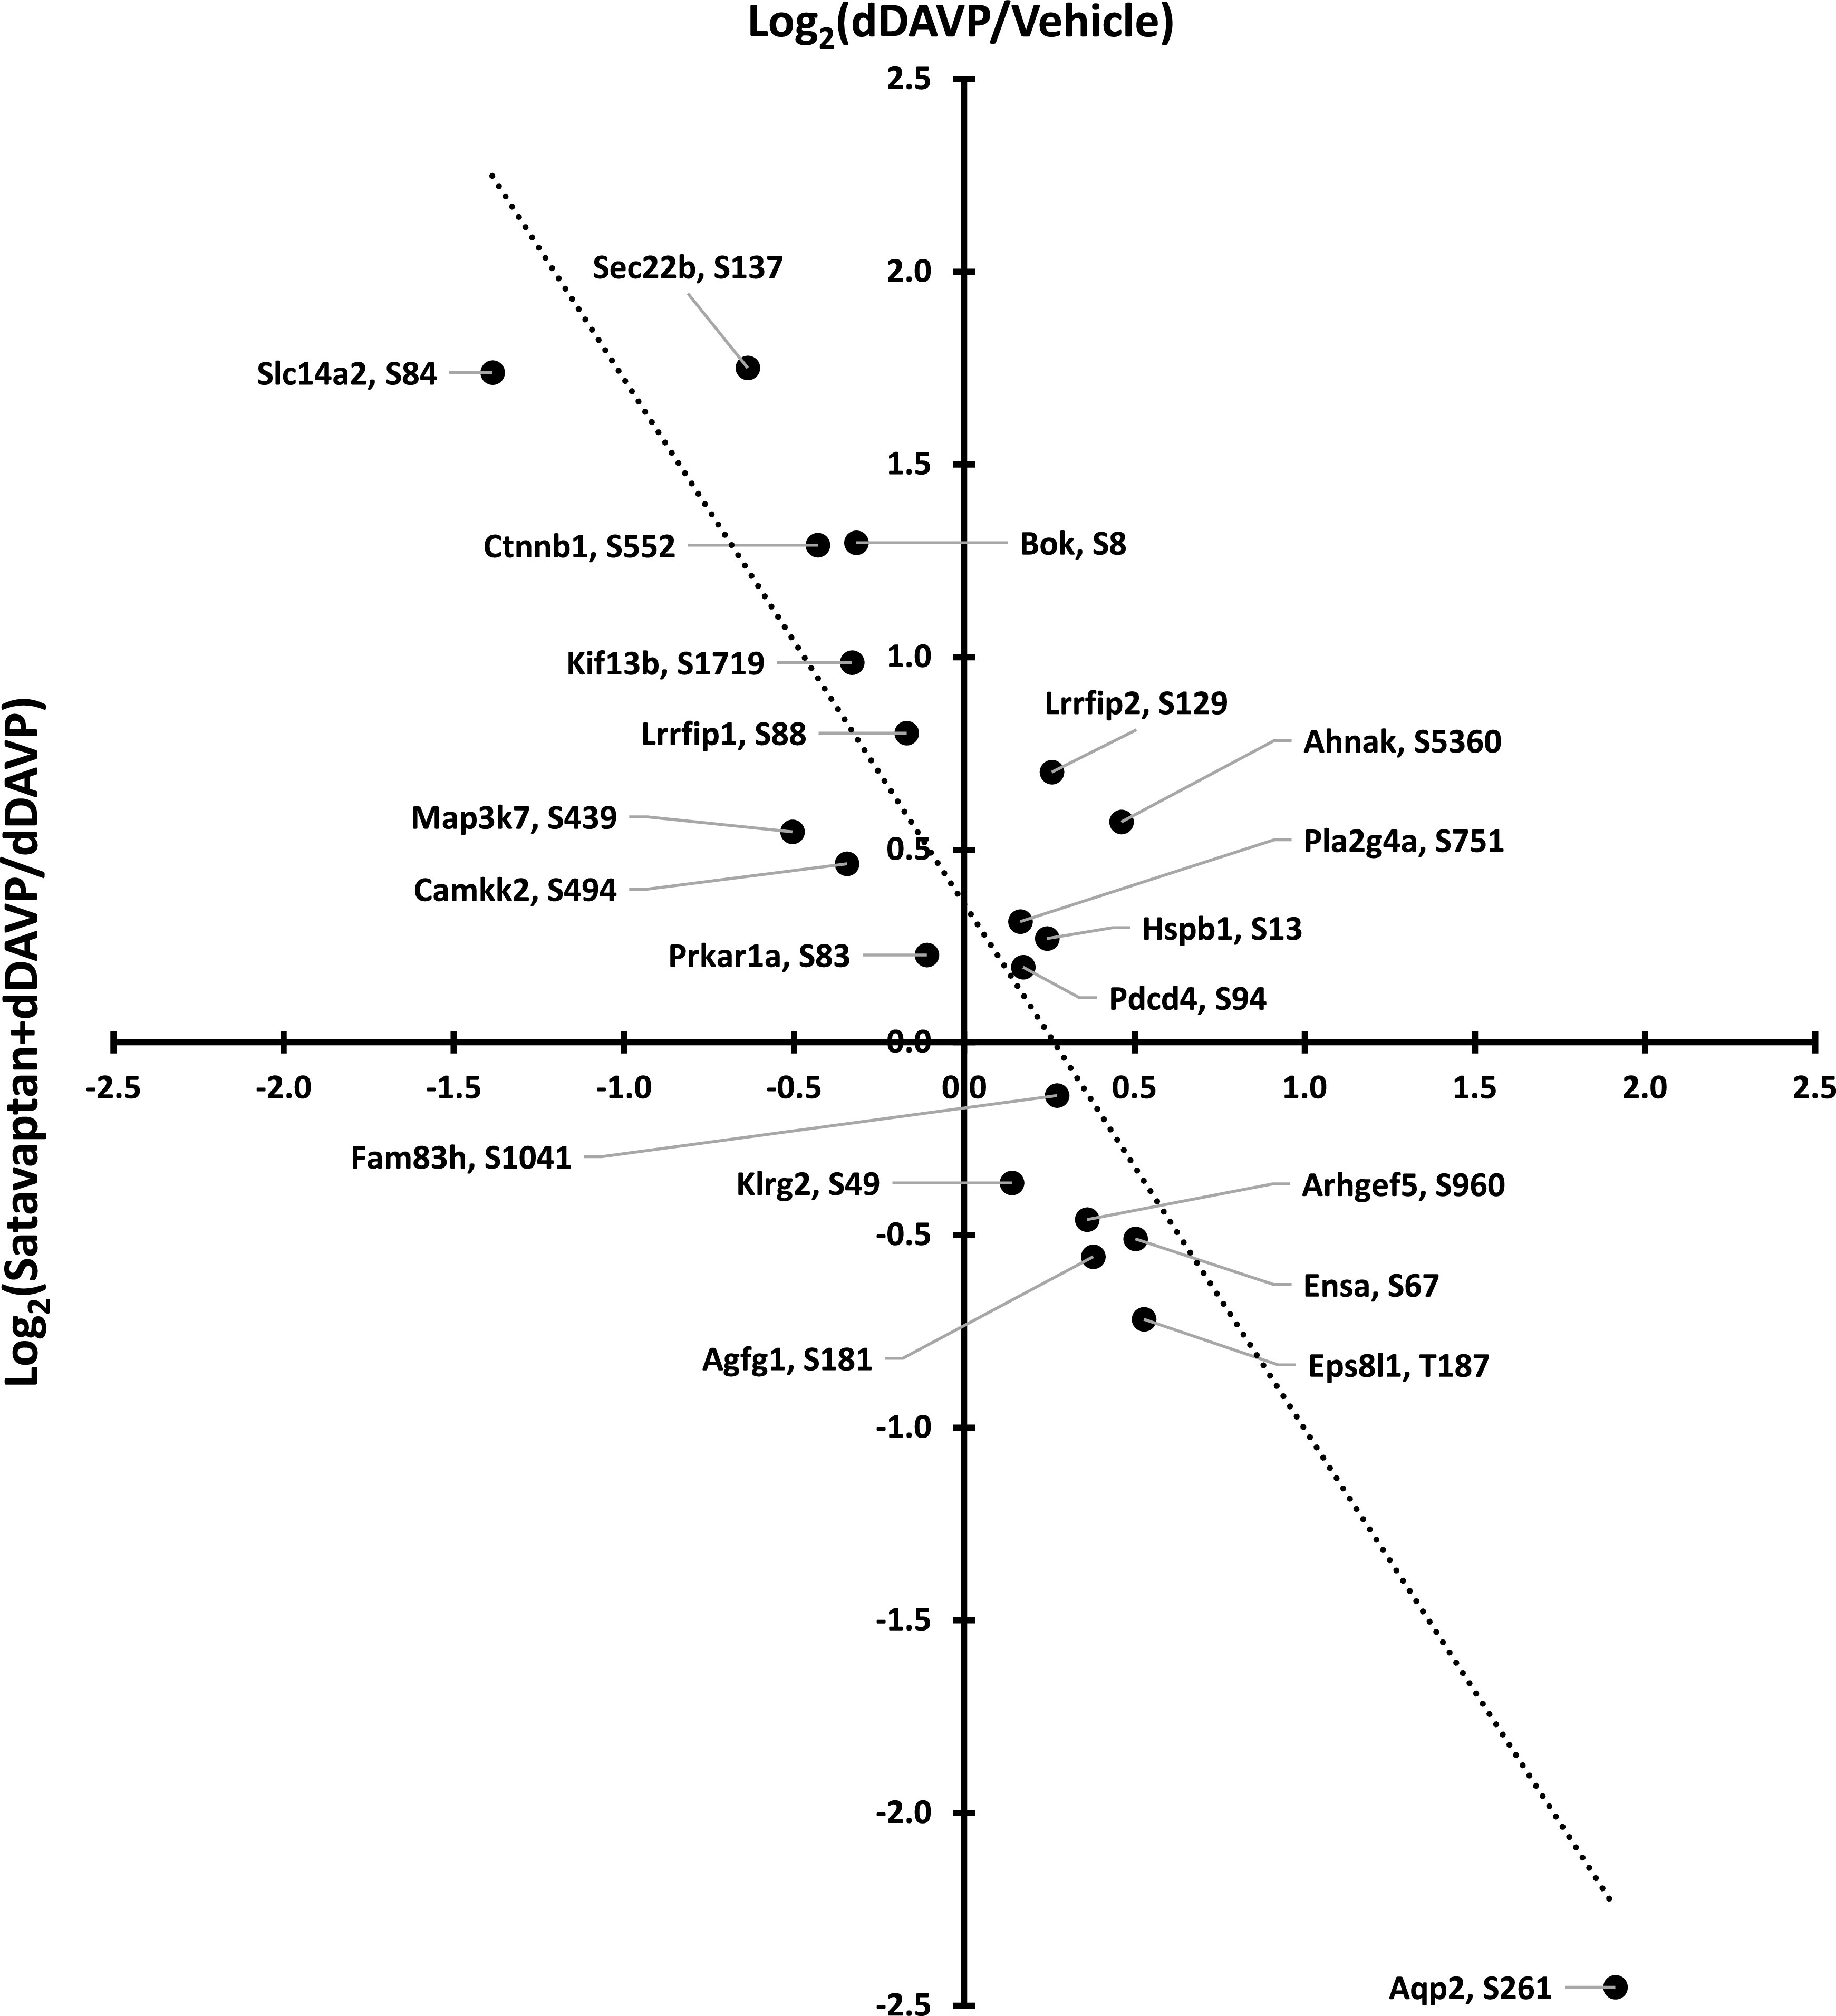
Fig. 6.

Comparison of phophoproteomic responses to a V2 vasopressin receptor antagonist satavaptan and to a V2 vasopressin receptor agonist dDAVP. Proteins are indicated by official gene symbols, with regulated phosphorylation sites indicated. Dotted line indicates best fit, linear regression.
