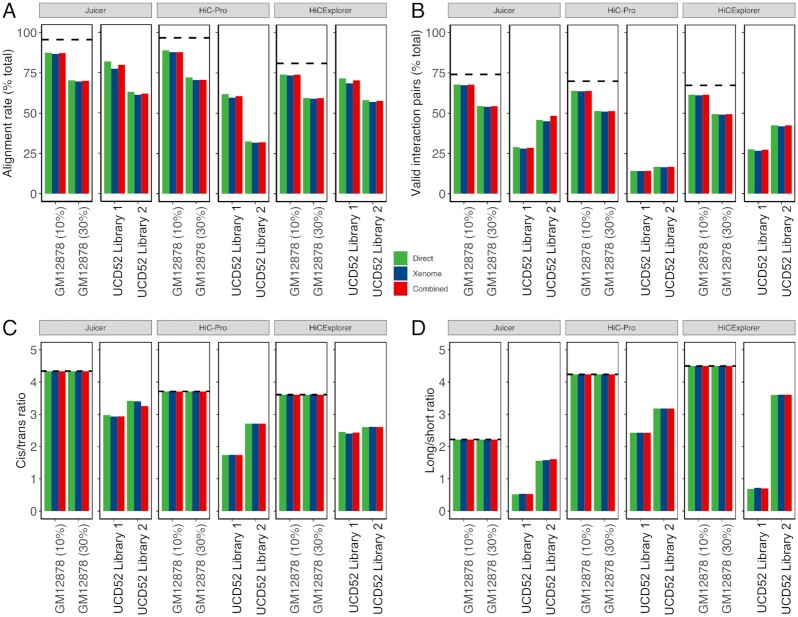
Figure 3:
Quality metrics for selecting the optimal pipeline for processing PDX Hi-C data. All metrics are stratified by the pipeline (Juicer, HiC-Pro, and HiCExplorer) and color-coded by the alignment strategy (green: Direct, blue: Xenome, red: Combined). (A) Alignment rate representing the proportion of all aligned reads. (B) The proportion of valid interaction pairs as determined by each pipeline. (C) The ratio of cis interacting pairs (i.e., occurring on the same chromosome) vs. trans interacting pairs (i.e., between chromosome interactions). (D) The ratio of long- vs short-interacting Hi-C contacts. Dashed lines correspond to the baseline alignment quality metrics for human Hi-C data without mouse reads.

