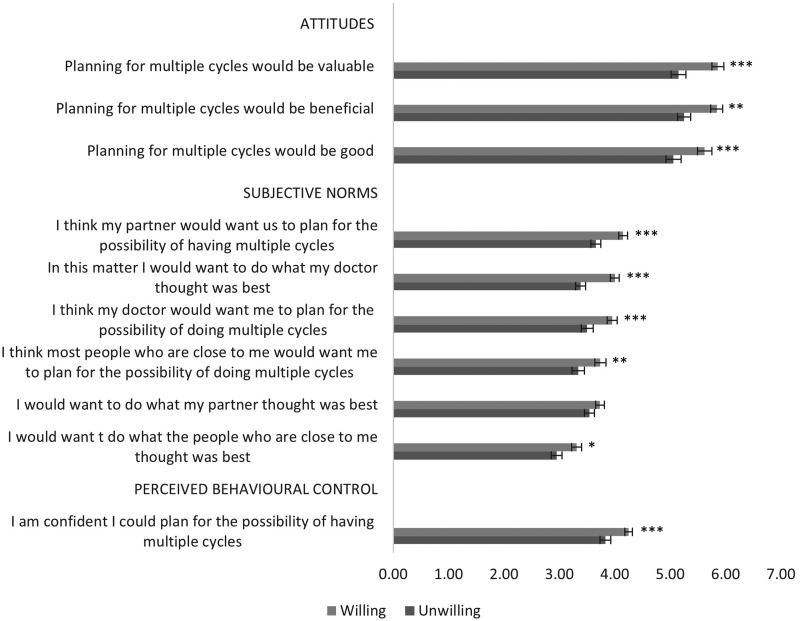
Figure 1.
Mean attitudes towards planning for multiple cycles of treatment and agreement with subjective norms and perceived behavioural control according to willingness group. Higher scores indicate more positive attitudes (scale 1–7) and agreement (scale 1–5). Error bars indicate 95% confidence interval around the mean. *p<.05, **p<.01, ***p<.001 for significant group differences.

