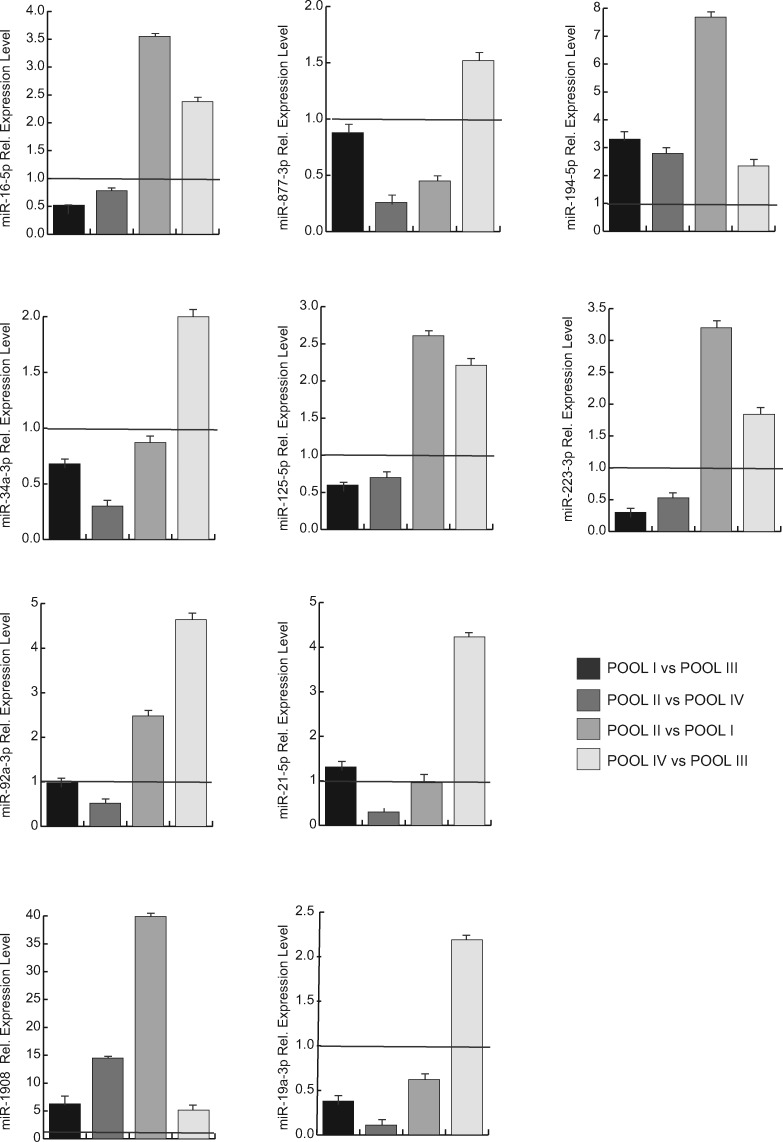
Figure 6.
Real-time PCR analysis of expression levels of selected differentially expressed miRNAs in COCs pools. The relative expression of miRNA normalized for RNU6B is shown and plotted as a fold change between different pools: POOL IV vs POOL III; POOL II vs POOL I; POOL II vs POOL IV; POOL I vs POOL III. Results represent the mean ± SD.

