
Figure 1. Neutralization of SARS-CoV-2 viral variants by mAbs.
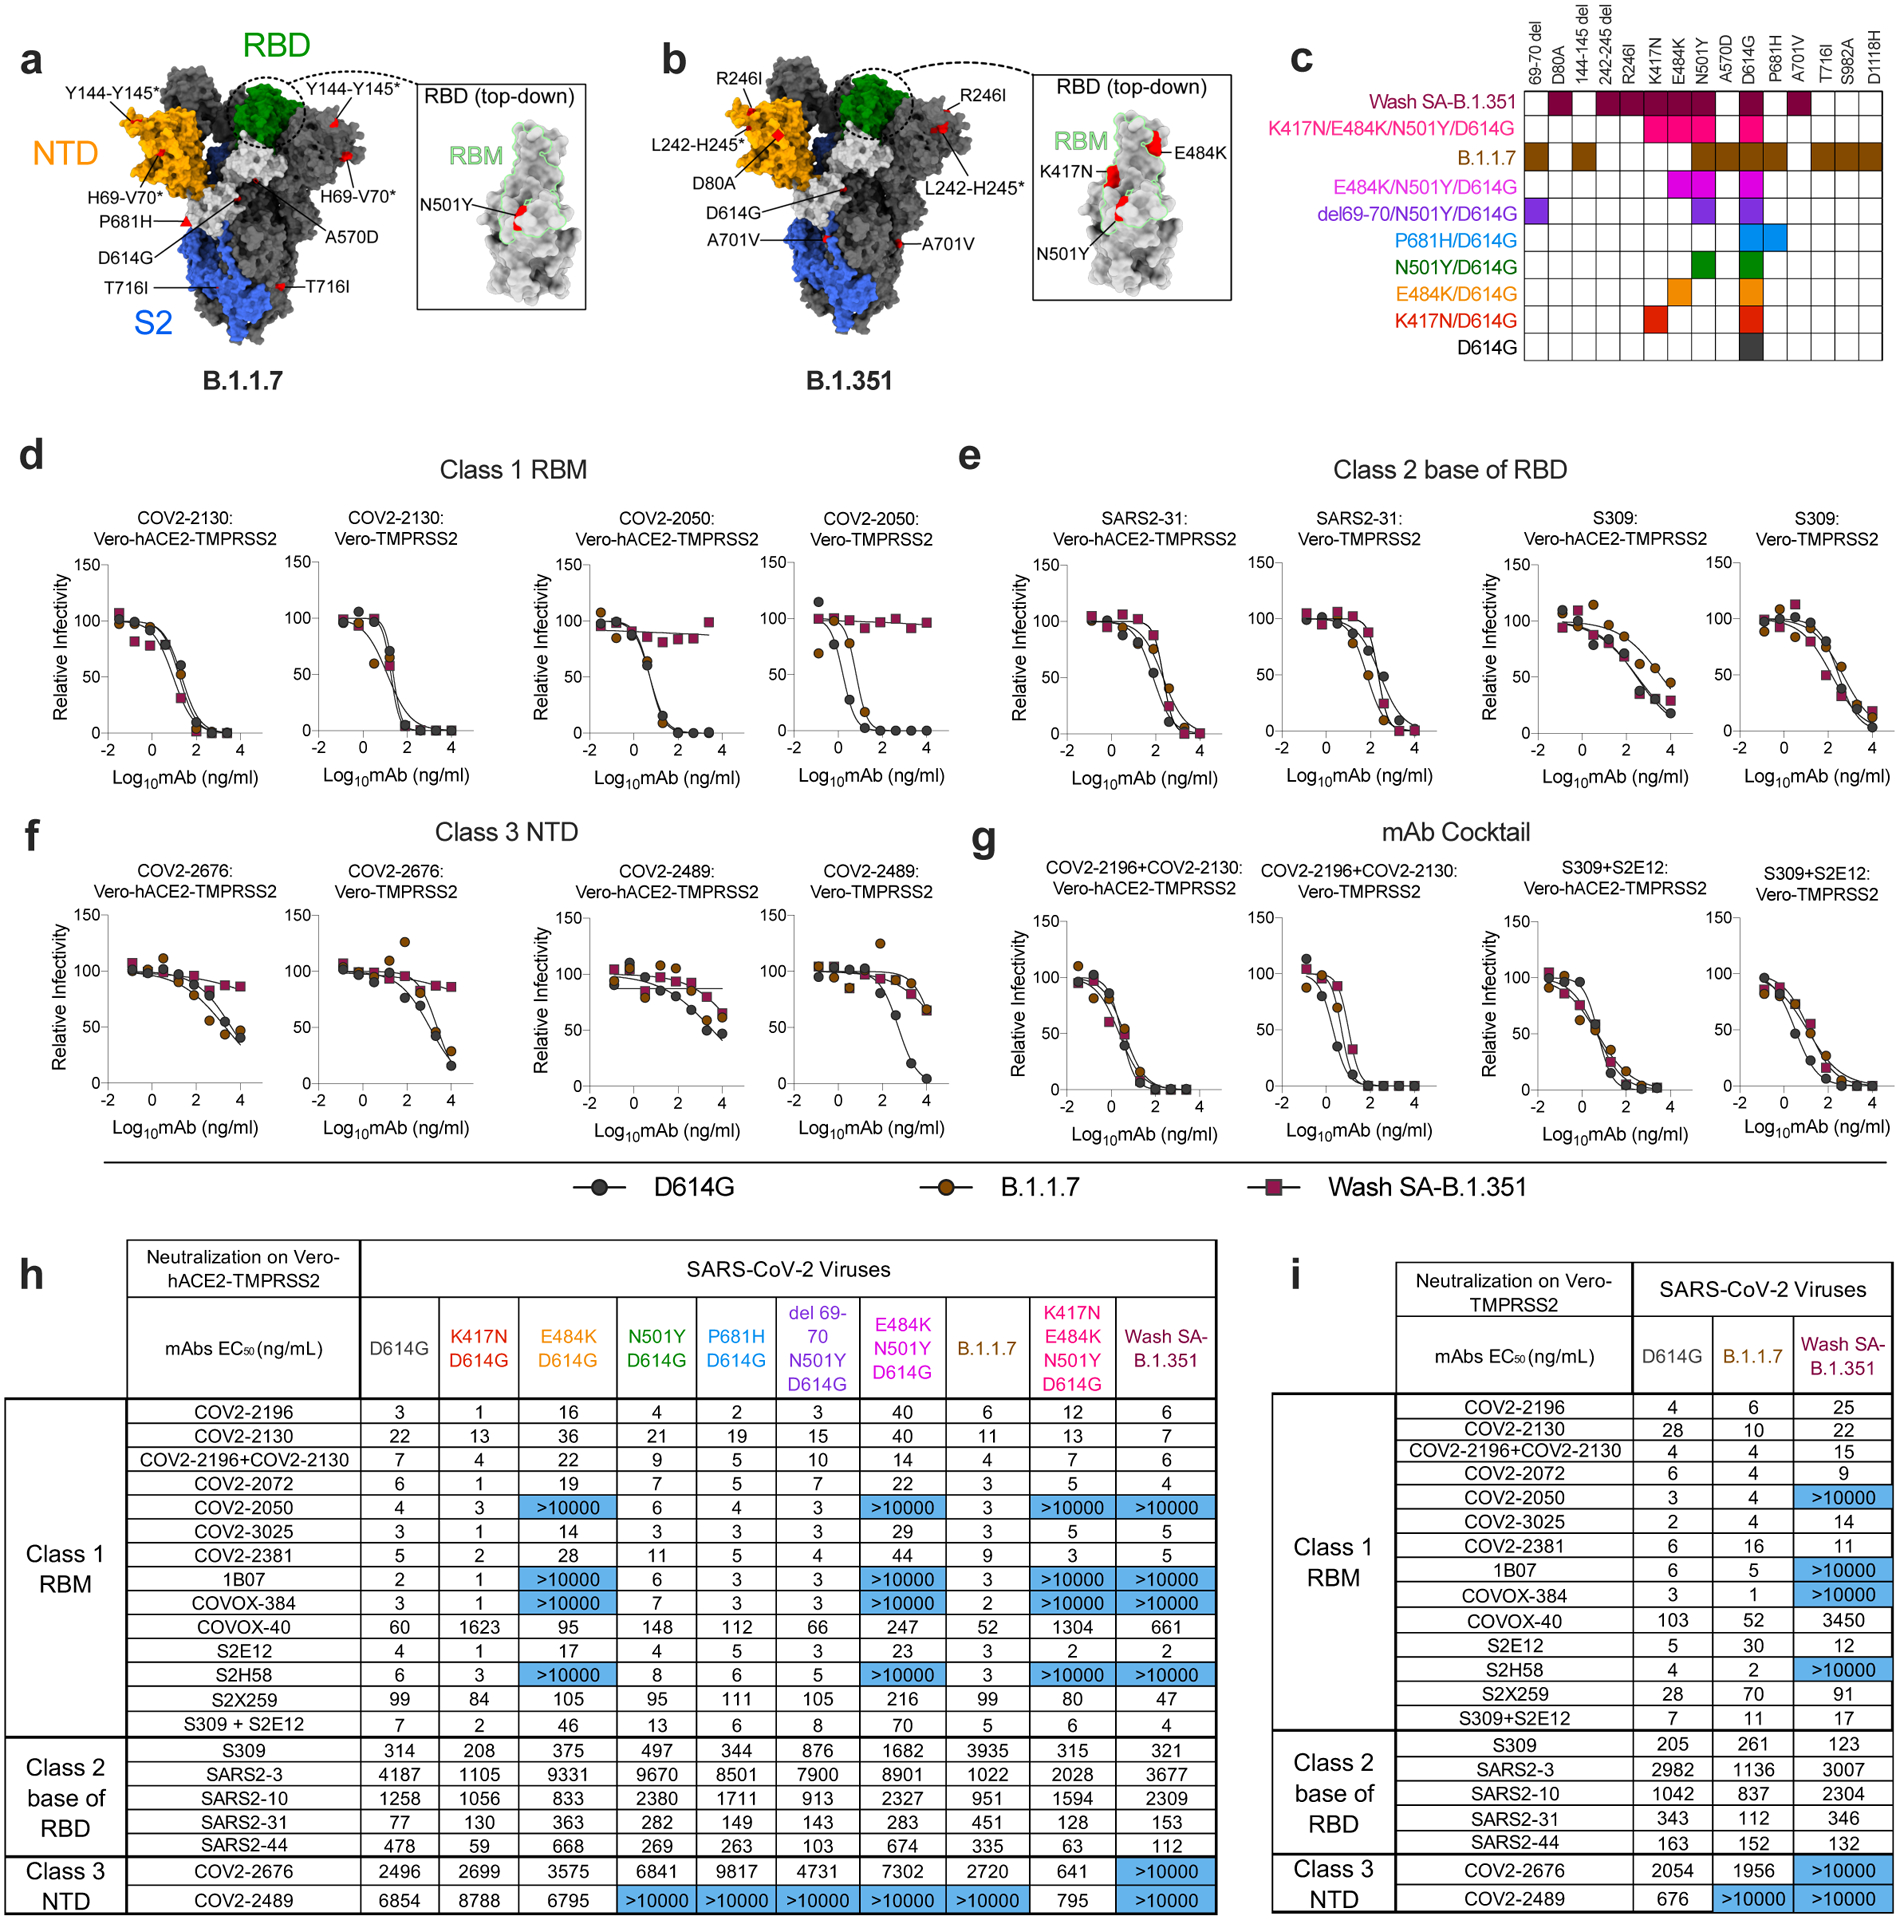
a-b, SARS-CoV-2 spike trimer. One protomer is highlighted, showing the NTD in orange, RBD in green, and S2 portion of the molecule in blue, with N- and C-termini annotated. a, Substitutions in the B.1.1.7 variant (69–70 deletion, 144–145 deletion, A570D, D614G, P681H, and T716I) are shaded in red. Red triangle depicts approximate location of P681H, which was not included in the model. Inset shows a top-down view of the RBD showing the location of the N501Y mutation contextualized with the receptor-binding motif (RBM). b, Substitutions in the Wash-SA B.1.135 variant (242–244 deletion, D80A, R246I, D614G, and A701V) are shaded in red. The red diamond denotes approximate location of D80A, which is buried in this view. Inset shows top-down view of the RBD with Wash SA-B.1.351 substitutions K417N, E484K, and N501Y shaded red and contextualized with the receptor binding motif. For all panels, structures depicting spike protein were modeled using PDB: 7C2L. Structures depicting RBD were modeled using PDB: 6W41. All analyses and figures were generated with UCSF ChimeraX47. c, Viruses with indicated spike mutations. d-f, Neutralization curves in (left panels) Vero-hACE2-TMPRSS2 cells or (right panels) Vero-TMPRSS2 cells comparing the sensitivity of SARS-CoV-2 strains with class 1 (d, COV2–2130 and COV-2150), class 2 (e, SARS2–31 and S309), and class 3 (f, COV2–2676 and COV2–2489) mAbs and indicated viruses. Also shown are the neutralization curves for antibody cocktails (g, COV2–2196 + COV2–2130 and S309 + S2E12). One representative experiment of two performed in technical duplicate is shown. h-i, Summary of EC50 values (ng/ml) of neutralization of SARS-CoV-2 viruses propagated on the indicated cells and performed in Vero-hACE2-TMPRSS2 (h) or Vero-TMPRSS2 (i) cells. Blue shading of cells shows virtually complete loss of neutralizing activity: EC50 > 10,000 ng/mL.