
Figure 3. Resistance of SARS-CoV-2 viral variants to neutralization by vaccine-induced serum derived from mice, hamsters, and NHPs.
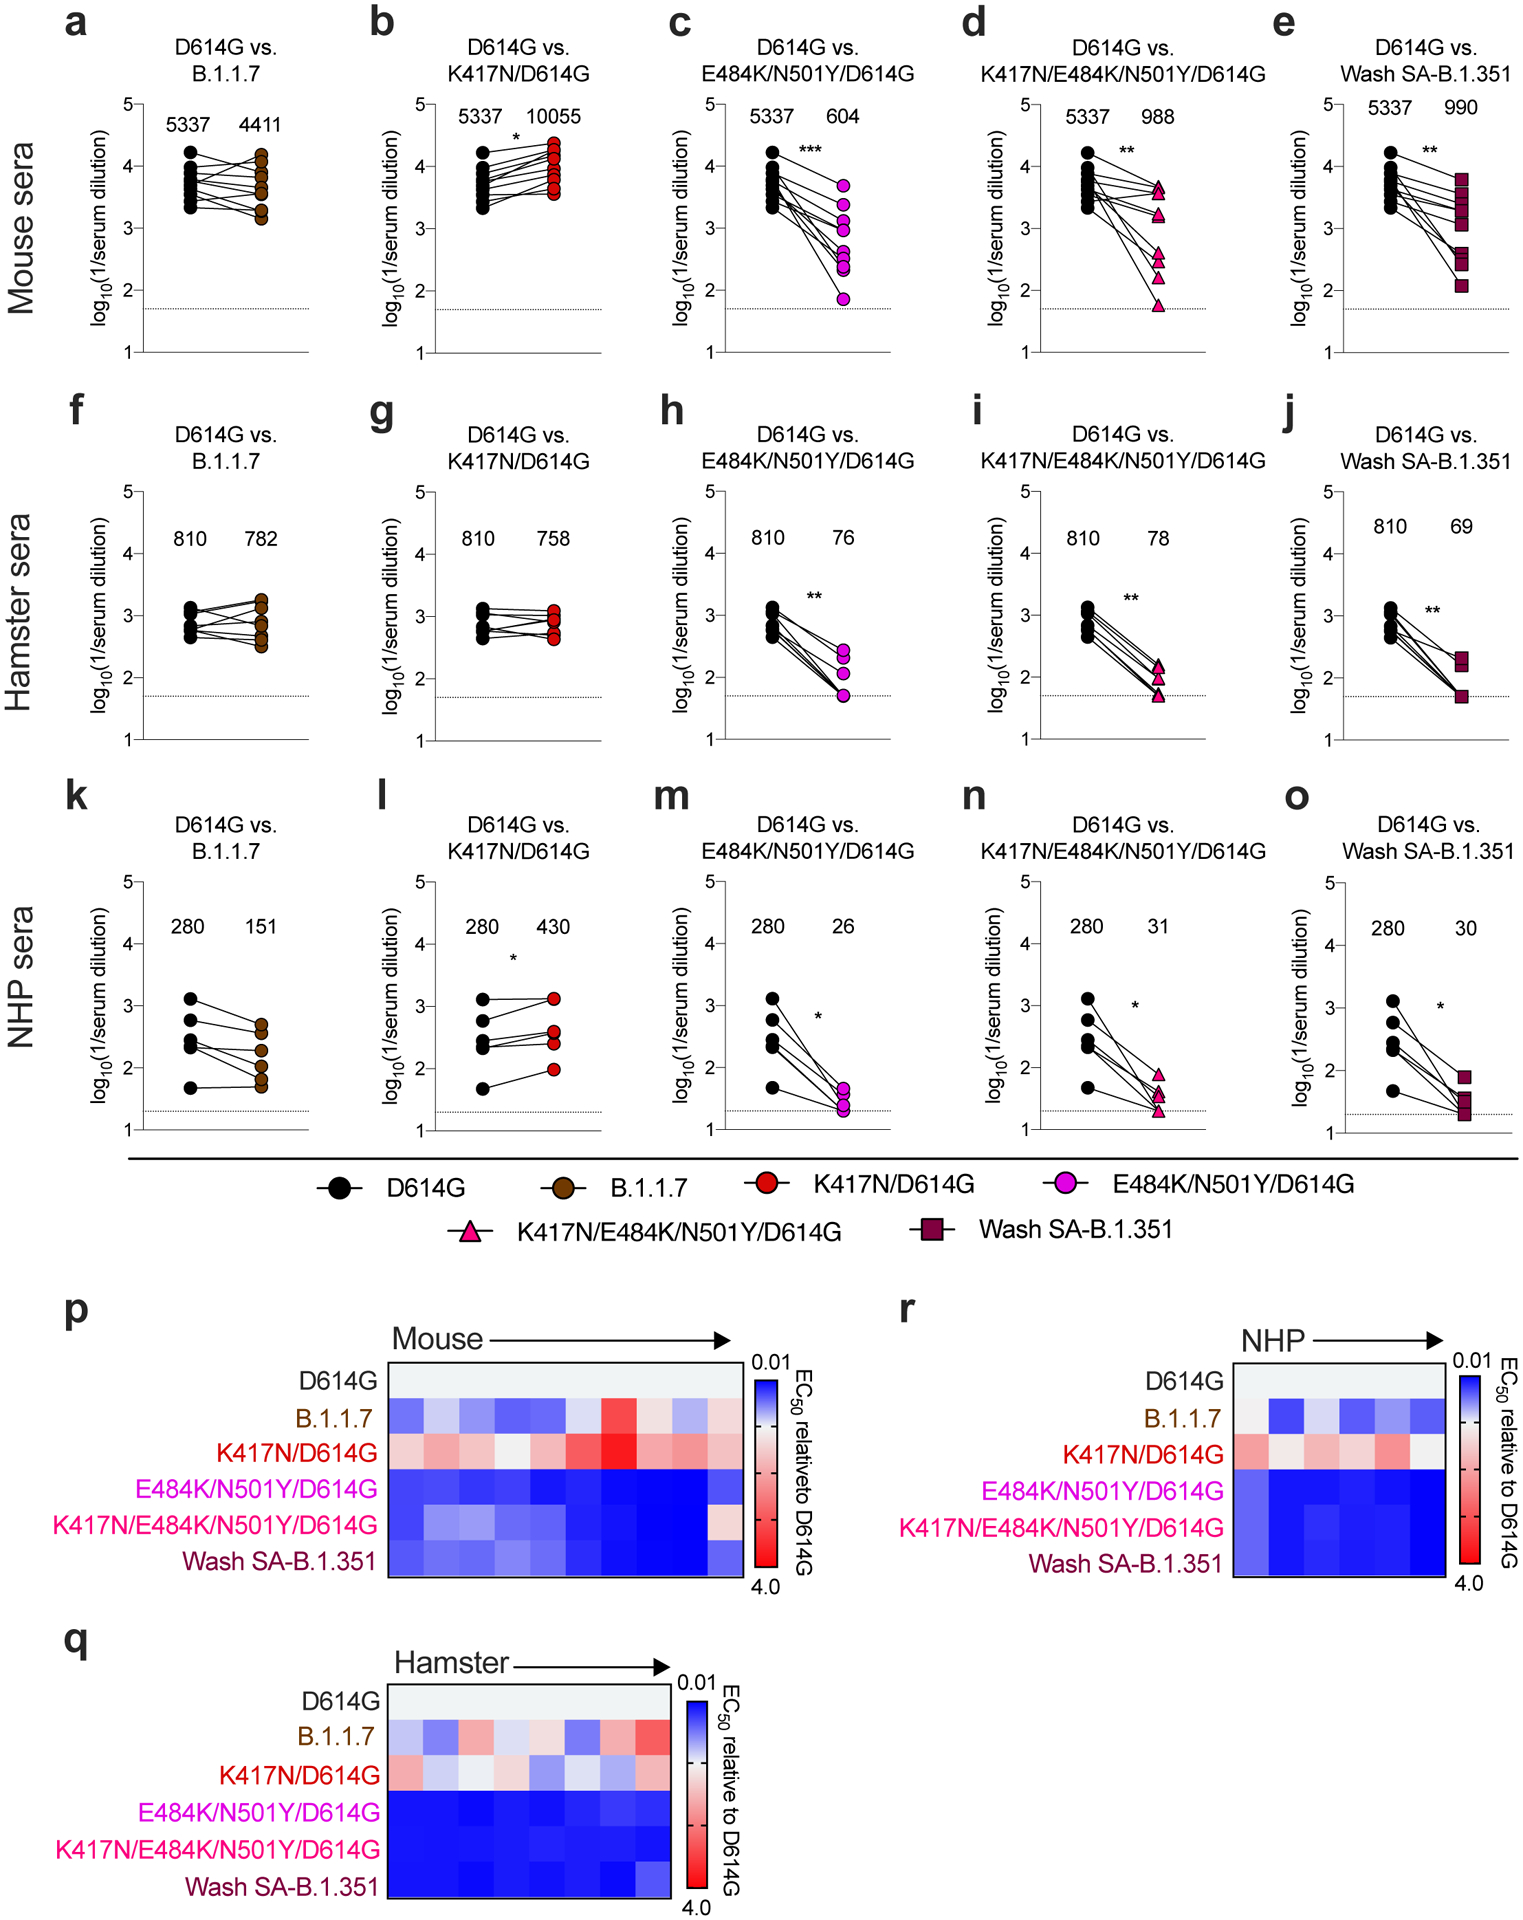
Paired analysis of neutralizing activity by sera from mice (a-e, n = 10), hamsters (f-j, n = 8), and NHPs (k-o, n = 6) obtained ~30 days after a single intranasal immunization with an adenoviral vectored SARS-CoV-2 vaccine (ChAd-SARS-CoV-2-S27). Neutralization data on Vero-hACE2-TMPRSS2 cells is displayed as WA1/2020 D614G versus the variant viruses: (a, f, k) B.1.1.7, (b, g, l) K417N/D614G, (c, h, m) E484K/N501Y/D614G, (d, i, n) K417N/E484K/N501Y/D614G, or (e, j, o) Wash SA-B.1.351. Results are from one experiment performed in duplicate, with some exceptions due to limited sample. GMT values are shown above each graph. Dotted line represents the limit of detection of the assay. Two-tailed Wilcoxon matched-pairs signed rank test: Mouse sera: D614G vs. B.1.1.7, P = 0.323; D614G vs. K417N/D614G, P = 0.0020; D614G vs. E484K/N501Y/D614G, P = 0.0020; D614G vs. K417N/E484K/N501Y/D614G, P = 0.0039; D614G vs. Wash SA-B.1.351, P = 0.0020. Hamster sera: D614G vs. B.1.1.7, P = 0.9453; D614G vs. K417N/D614G, P > 0.9999; D614G vs. E484K/N501Y/D614G, P = 0.0078; D614G vs. K417N/E484K/N501Y/D614G, P = 0.0078; D614G vs. Wash SA-B.1.351, P = 0.0078. NHP sera: D614G vs. B.1.1.7, P = 0.0625; D614G vs. K417N/D614G, P = 0.0312; D614G vs. E484K/N501Y/D614G, P = 0.0312; D614G vs. K417N/E484K/N501Y/D614G, P = 0.0312; D614G vs. Wash SA-B.1.351, P = 0.0312. p-r, Heat maps of the relative neutralizing activity of sera from individual mice (p), hamsters (q), and NHPs (r) against indicated SARS-CoV-2 viruses compared to WA1/2020 D614G. Blue, reduction; red, increase.