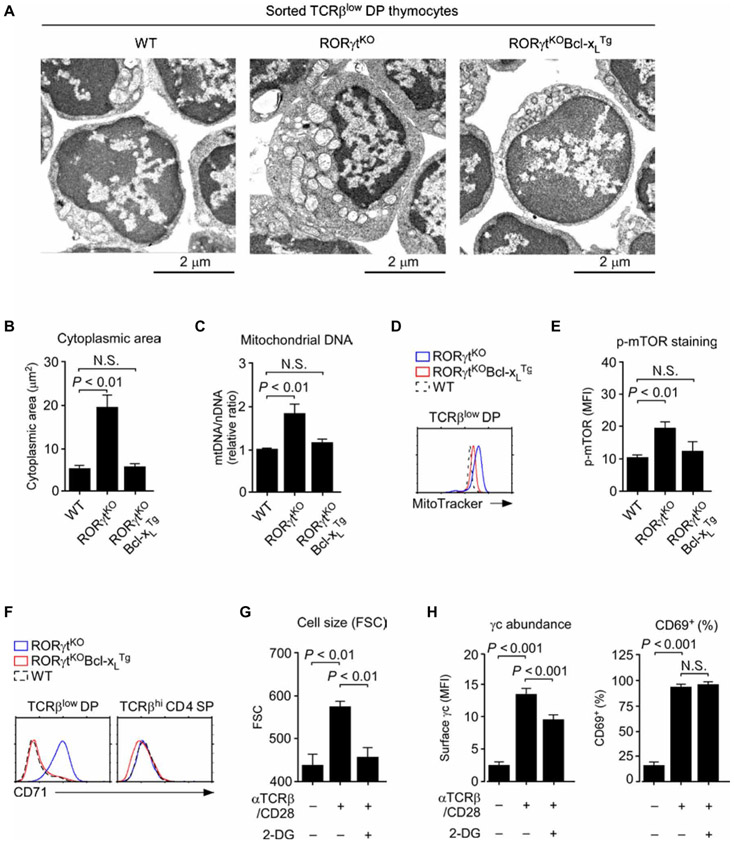
Fig. 5. RORγt is required to suppress metabolic activity in immature DP thymocytes.
(A) Electron microscopy of sorted TCRβlow DP thymocytes from the indicated mice. Images are representative of at least five analyses per genotype. (B) Cytoplasmic areas were determined from electron microscopy images of TCRβlow DP thymocytes from the indicated mice using the National Institutes of Health (NIH) ImageJ software. Data are means ± SEM of five to nine cells for each genotype. (C) Mitochondrial content was determined as the ratio of mtDNA to nDNA upon total DNA extraction and PCR analysis of sorted TCRβlow DP thymocytes from the indicated mice. Data are means ± SEM of two independent experiments. (D) Histogram shows representative MitoTracker Green staining of TCRβlow DP thymocytes from the indicated mice. Data are representative of four independent experiments. (E) Analysis of the amount of intracellular phosphorylated mammalian target of rapamycin (p-mTOR) in TCRβlow DP thymocytes from the indicated mice. Data are means ± SEM of four independent experiments. (F) Flow cytometric analysis of cell surface CD71 abundance on TCRβlow DP (left) and mature TCRβhi CD4 SP (right) thymocytes from the indicated mice. Histograms are representative of three independent experiments. (G) FSC signals were used to determine cell size for WT CD4 SP thymocytes stimulated with plate-bound antibodies against TCR and CD28 (αTCRβ/CD28; each at 1 μg/ml) in the presence or absence of 10 mM 2-deoxy-d-glucose (2-DG). Data are means ± SEM of three independent experiments. (H) Cell surface γc (left) and CD69 (right) abundance was determined on WT CD4 SP thymocytes stimulated with plate-bound antibodies against TCR and CD28 (each at 1 μg/ml) in the presence or absence of 10 mM 2-DG. Data are means ± SEM of three independent experiments.

