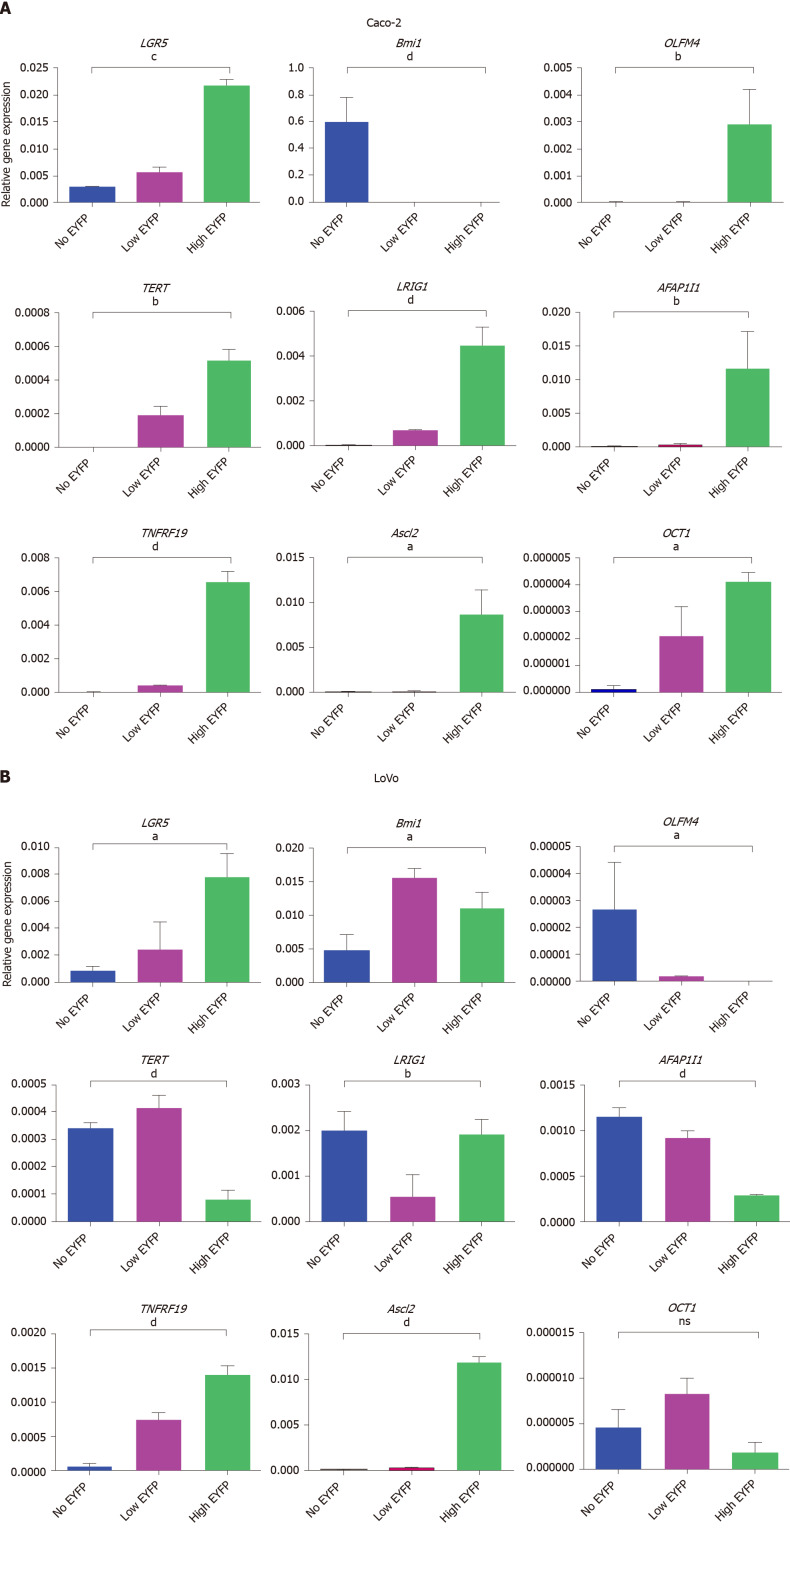
Figure 2.
Quantitative polymerase chain reaction analysis. A and B: Quantitative polymerase chain reaction analysis of intestinal stem cell markers and the cancer stem cell marker organic cation transporter 1 in leucine-rich repeat-containing G protein-coupled receptor 5/enhanced yellow fluorescent protein (LGR5/EYFP)high, LGR5/EYFPlow, and LGR5/EYFPnegative fractions of the Caco-2 cell line (A) and the LoVo cell line (B). The expression value of each gene was normalized to glyceraldehyde-3-phosphate dehydrogenase gene. Data were then analyzed by one-way analysis of variance. aP < 0.05, bP < 0.01, cP < 0.001, dP < 0.0001. LGR5: Leucine-rich repeat-containing G protein-coupled receptor 5; EYFP: Enhanced yellow fluorescent protein; Bmi1: B lymphoma Moloney murine leukemia virus insertion region 1 homolog; OCT1: organic cation transporter 1; TERT: Telomerase reverse transcriptase; ASCL2: Achaete-scute complex homolog 2.

