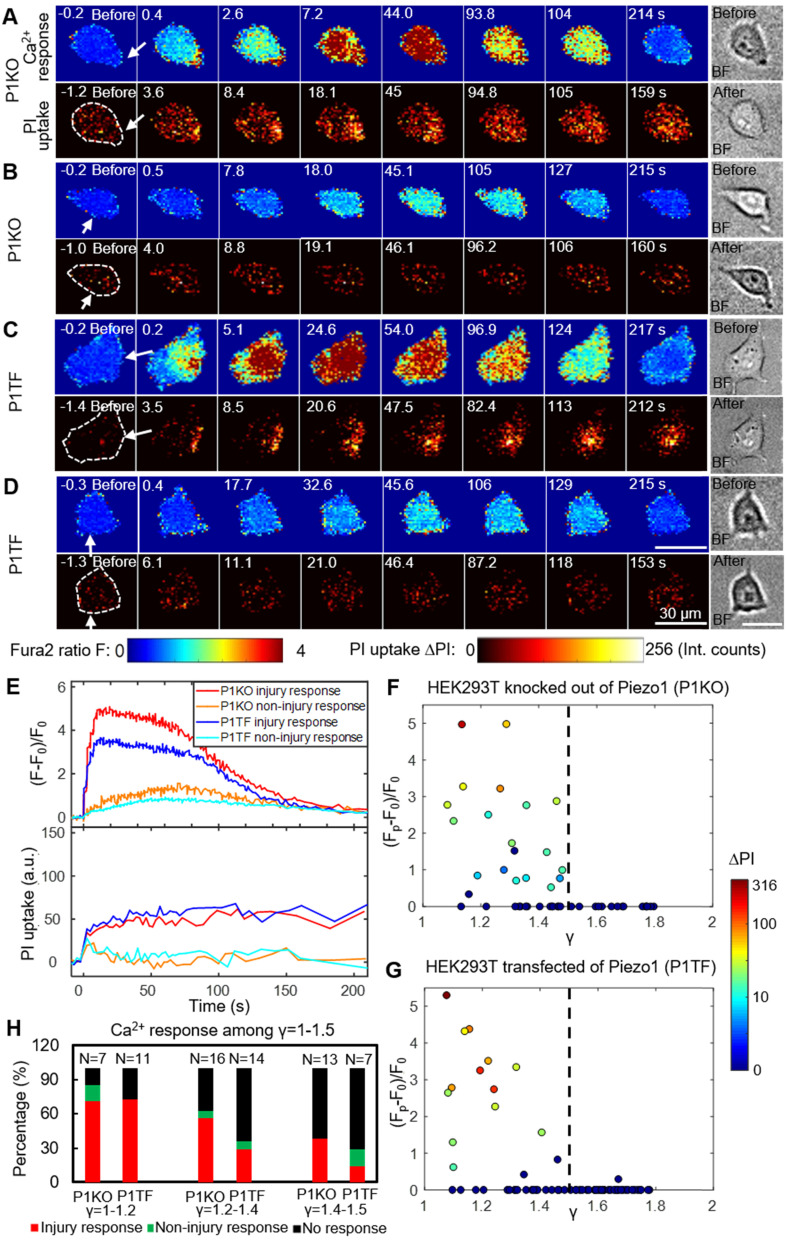
Figure 2.
Intracellular Ca2+ response and PI uptake in SCB-stimulated cells. (A-D) Time series showing intracellular Ca2+ response (top rows) and PI uptake (bottom rows) in representative individual cells with membrane poration (A, C) or without membrane poration (B, D), for Piezo1 knockout cells (P1KO) (A-B) and cells transiently expressing Piezo1 (P1TF) (C-D). Right: Single-shot bright-field images of cells before and after SCB treatment. The white arrow indicates the direction of radial expansion of the SCB at the location closest to the cell. Left: The cell contour before treatment is outlined with white dashed lines in the first PI image. Cells were exposed to SCB at t = 0. Scale bars, 30 µm. (E) Temporal profiles of averaged intracellular Ca2+ response and PI uptake inside each cell shown in A-D. (F) and (G) Peak intracellular Ca2+ response (circles) versus the normalized standoff distance for P1KO and P1TF cells. PI uptake values are color-coded. Almost all elicited Ca2+ responses occurred at γ = 1-1.5. (H) Overall Ca2+ response probability at γ = 1-1.5, including cells with an injury response (red), non-injury response (green), and no response/no injury (black) at different ranges of γ (1-1.2, 1.2-1.4, and 1.4-1.5). N indicates the number of cells in each group.

