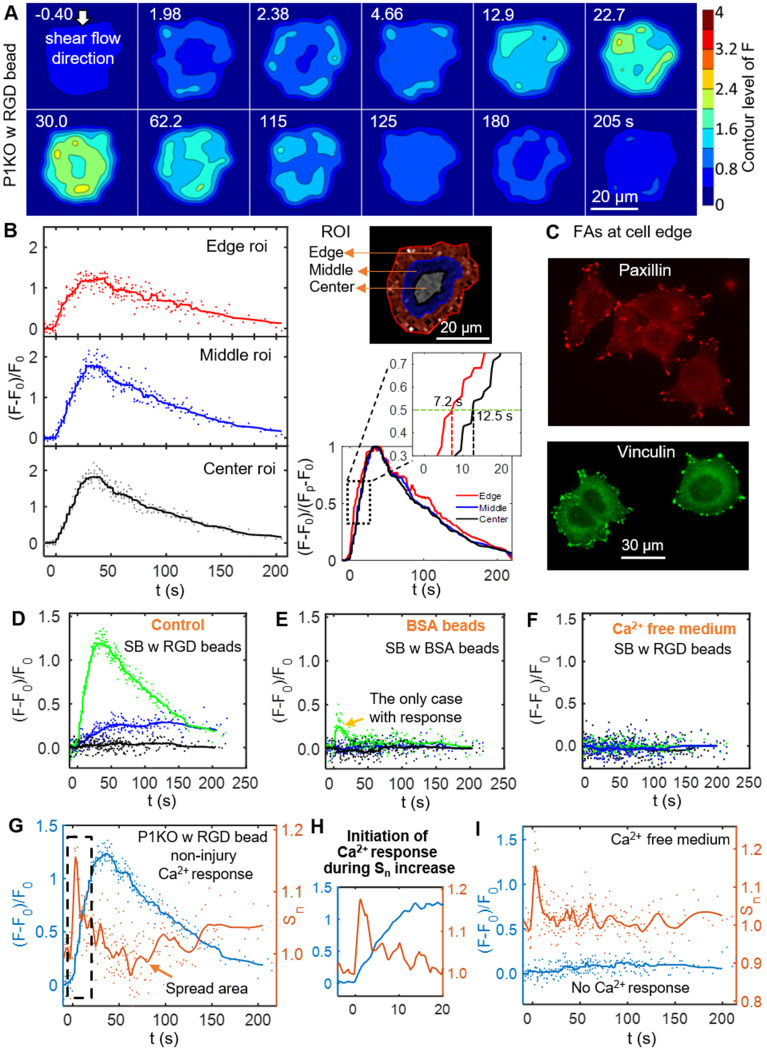
Figure 4.
Initiation of the Ca2+ wave and localization of the focal adhesion molecules paxillin and vinculin at the cell periphery, and Ca2+ influx during the increase in cell spread area. (A) Surface contour of F = I340/I380 (ratiometric imaging of Ca2+ signaling amplitude) for a P1KO cell with RGD beads exhibiting a non-injury Ca2+ response (the same cell as in Figure 3C). (B) Small region analysis (edge, middle and center ROI) of the Ca2+ response for the cell in panel A. Left: Time traces of (F-F0)/F0 and median averaging. Top right: ROIs labels. Bottom right: A normalized version of the median averaging line traces is shown in the dashed box around (F-F0)/(Fp-F0) = 0.5 (horizontal dashed line). (C) Fluorescence images of focal adhesion proteins paxillin and vinculin in P1KO cells after 3 h of spreading on a gold- and FN-coated dish. (D-F) Time traces of (F-F0)/F0 for SCB-treated P1KO cells with (i) RGD beads, (ii) BSA beads, and (iii) RGD beads in Ca2+-free medium. (G) Time traces of Ca2+ response and normalized change in cell spread area (Sn) for a SCB- and RGD-bead treated P1KO cell exhibiting a non-injury Ca2+ response. Solid lines indicate median averages (see Materials & Methods). (H) Enlarged image of the dashed box in panel G showing that the Ca2+ response is initiated during the increase in Sn. (I) Time traces of (F-F0)/F0 and Sn for a no-response case in Ca2+-free medium, with a similar transient increase in Sn as seen in panel H, indicating that Ca2+ entry is necessary for RGD bead-enhanced response. All cases shown are cells stimulated with SCB at γ = 1.5-1.8.

