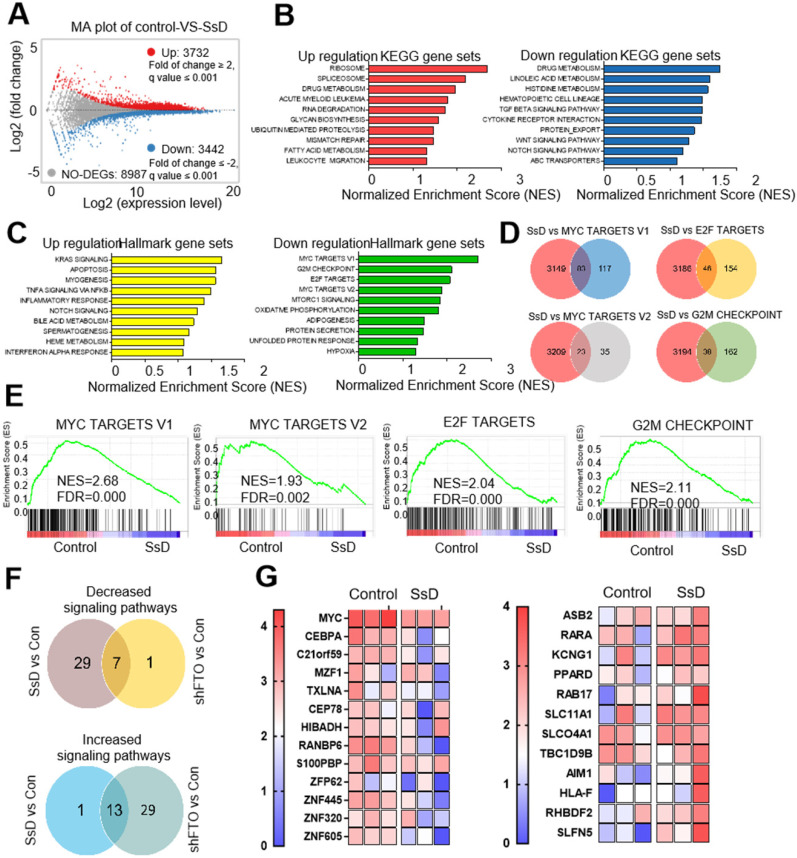
Figure 2.
Identification of genes and pathways related to the SsD response. (A) Representative scatter plot of 7174 genes in control vs SsD-treated NB4 cells, 3732 upregulated genes are marked in red while 3442 downregulated genes are marked in blue. (B) KEGG pathway analysis of both downregulated and upregulated genes (based on the RNA-seq results) in control vs SsD-treated NB4 cells. P-value was corrected by FDR, and the FDR < 0.01 was considered significantly enriched. (C) Similarly, Gene Set Enrichment Analysis (GSEA) of pathways for the downregulated and upregulated genes in control vs SsD-treated NB4 cells. The P-value was corrected by FDR, and the FDR < 0.01 was considered significantly enriched. (D) Venn diagram showing the core genes of SsD-suppressed signaling pathways and the four shared signaling pathways in MSigDB database. (E) The top four signaling pathways suppressed by SsD in NB4 cells. (F) Venn diagram showing up- or downregulated genes in signaling pathways after SsD treatment or knockdown-mediated FTO inhibition. (G) Heat map analysis for significantly down-regulated or up-regulated gene in SsD treated NB4 cells.

