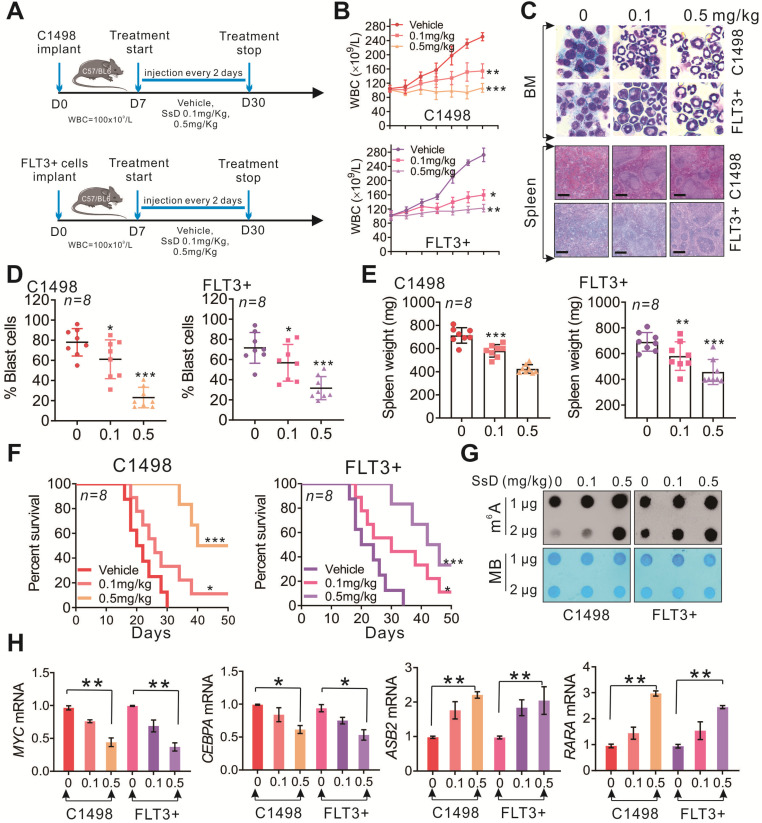
Figure 5.
SsD significantly inhibits the progression of sensitive AMLs in vivo. (A) Leukemic mice were developed by intravenous injection of C1498 and FLT3+ cells into 4 weeks old C57BL/6 mice. The WBC count was used as an indicator for the development of leukemic disease. SsD or vehicle was injected 3 times a week for 3 weeks. (B) WBC count of leukemia-bearing mice (n = 8) is shown. (C) Images show representative external views of the spleen with histological analysis of H&E-stained spleen sections (Scale bars, 1 cm, lower) and Wright-Giemsa-stained bone marrow (BM) cells (upper). (D-E) The quantification for blast cells and spleen weight is shown. (F) The survival curve of leukemia-bearing mice was calculated by Kaplan-Meier survival analysis (n = 8). (G) Using the dot blot assay, m6A abundance was determined in the RNA samples in SsD-treated primary BM cells at 48 h. The results were obtained from two biological replicates. (H) qPCR expression analysis of MYC, CEBPA, ASB2, and RARA in BM. Data are the mean ± SD; *P < 0.05, **P < 0.01.

