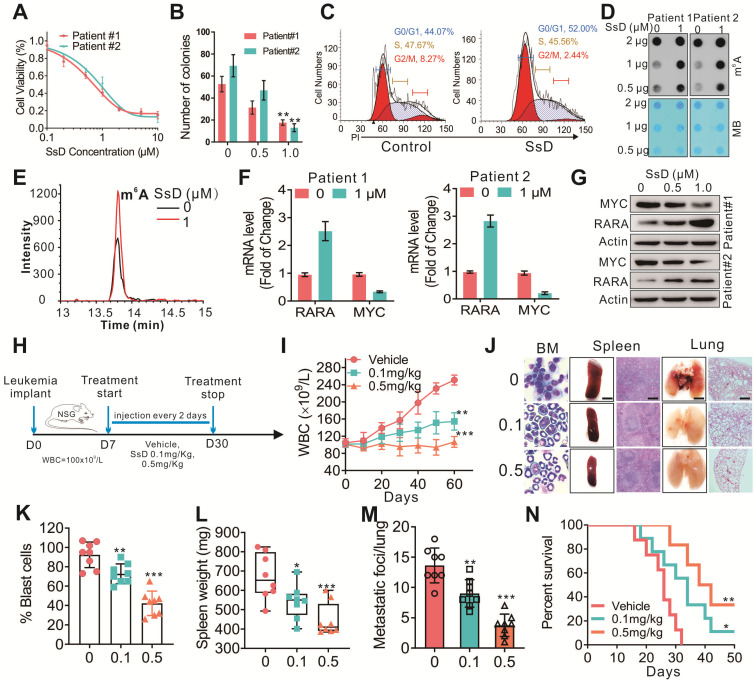
Figure 6.
SsD inhibits patient primary cells. (A) CCK-8 assays in the cells derived from two patients treated with SsD for 48 h. (B) Colony-forming assays of patient cells treated with SsD. Graphs showing the colony number from 3 independent experiments. Data are the mean ± SD; *P < 0.05, **P < 0.01. (C) Effect of SsD on cell-cycle arrest was determined using FACS based on PI staining in patient cells after 48 h of treatment. (D) After 48 h of SsD treatment, m6A abundance in the RNA samples was determined in primary patient cells using a dot blot assay. (E) TSQ traces of FTO demethylation of m6A in ssRNA in the absence and presence (1 µM SsD for 48 h) of SsD in patient cells. (F) qPCR expression analysis of the indicated genes in patients' SsD-treated cells. Data represent three independent experiments. (G) Western blot analysis of the indicated genes in patients' SsD-treated cells. (H) Leukemia-bearing mice were developed by intravenous injection of patient cells into 4-week old NSG mice. (I) WBC count of leukemia-bearing mice (n = 3) is shown. (J) Images show representative external views of the spleen with the histological analysis of H&E-stained spleen sections (Scale bars, 1 cm, middle), Wright-Giemsa-stained bone marrow (BM) cells (left), and external views of the lung with H&E-stained sections (right) from leukemia-bearing mice. (K-M) The quantification of blast cells (K), spleen weight (L), and tumor growing nodules on lung (M) are shown. (N) The survival curve of leukemia-bearing mice calculated by Kaplan-Meier survival analysis (n = 5) is shown.

