Figure 7.
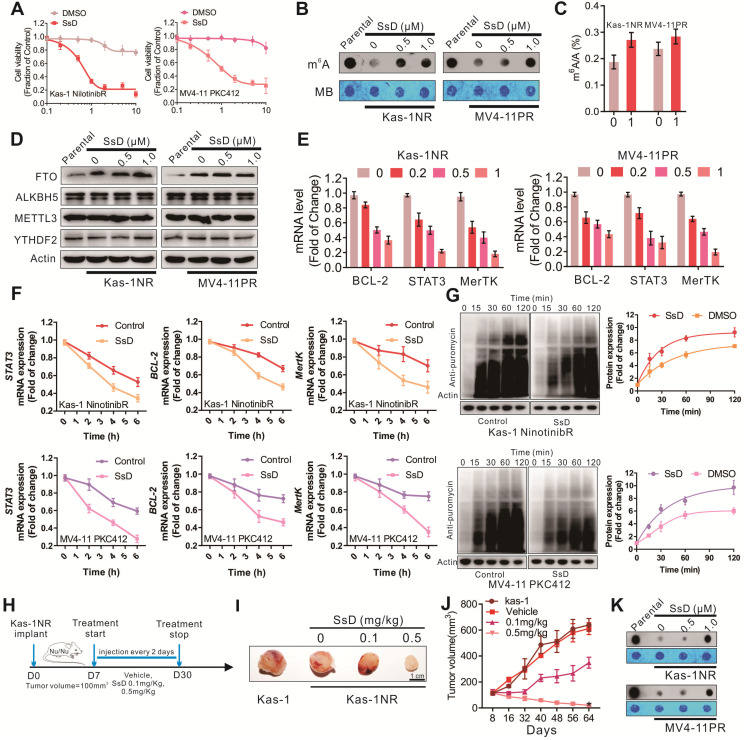
SsD overcomes N6-methyladenosine-mediated leukemia resistance to tyrosine kinase inhibitors. (A) CCK-8 assays in resistant cells treated with SsD for 24 h. (B) Dot blot analysis of m6A abundance in the RNA samples in parental resistant cells after 48 h of SsD treatment is shown. (C) Quantitation of m6A/A in mRNA in resistant cells treated with 1 µM SsD for 48 h was performed using LC-MS/MS. (D) Western blot analysis of indicated genes in resistant cells treated with SsD is shown. (E) qPCR expression analysis of indicated genes in resistant cells treated with SsD is shown. Data represent three independent experiments. (F) qPCR analysis of Kas-1NR and MV4-11PR cells treated with SsD for 24 h, followed by 5 µg/mL actinomycin-D treatment for the indicated time points is shown. The gene expression levels were normalized to GAPDH. (G) Western blot analysis of anti-puromycin in cells treated with SsD for 48 hours, followed by 200 nM puromycin treatment for the indicated time points is shown. Graphs are the quantitative representation of Western blot results normalized to β-actin. (H) Leukemia-bearing mice were developed by intravenous administration of Kas-1 or Kas-1NR (0.5×10⁶) cells into 4-week old mice (three times a week for three weeks). (I) Images of tumors and (J) quantification of tumor growth are shown. (K) m6A dot blot analysis in tumors is presented.

