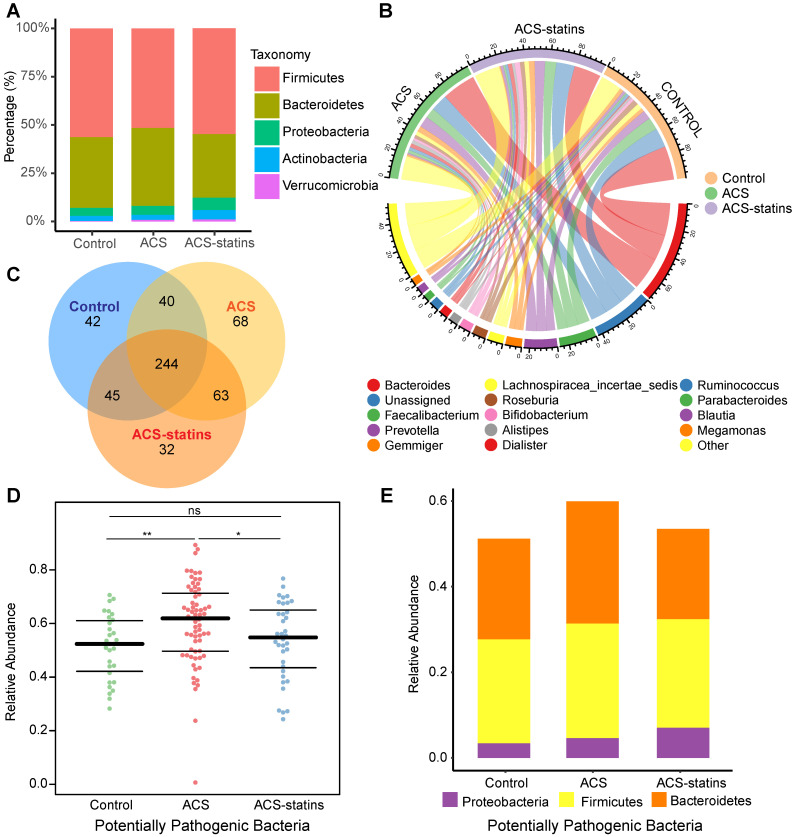
Figure 1.
Overview of the gut microbiome in different groups. (A) Dominant phyla in each group. (B) Dominant genera and their contribution to each group. (C) A Venn diagram demonstrating the existence of ASVs in each group. (D) Relative abundance of potentially pathogenic bacteria predicted based on the BugBase database. *P < 0.05, **P < 0.01, ns: not significant, Mann-Whitney U test. (E) Distribution of potentially pathogenic bacteria at the phylum level in each group.

