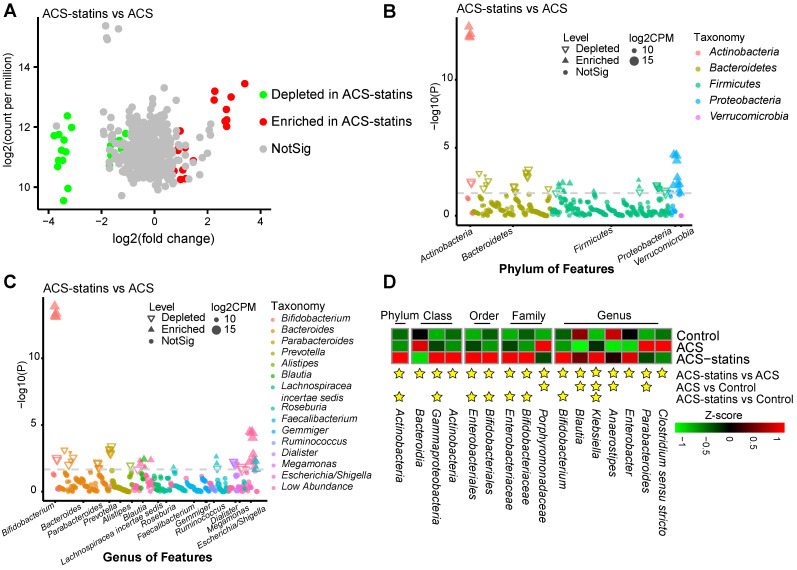
Figure 2.
Alterations in the composition of fecal microbiota associated with statin treatment. (A) A volcano plot demonstrating differential ASVs between the ACS-statins group and the ACS group. (B) A Manhatten plot showing the distribution of differential ASVs at the phylum level. (C) A Manhatten plot showing the distribution of differential ASVs at the genus level. (D) A heatmap illustrating the relative abundance of statin-associated taxa across the three groups. A threshold of P < 0.05 and FDR < 0.2 calculated by edgeR was considered statistically significant.

