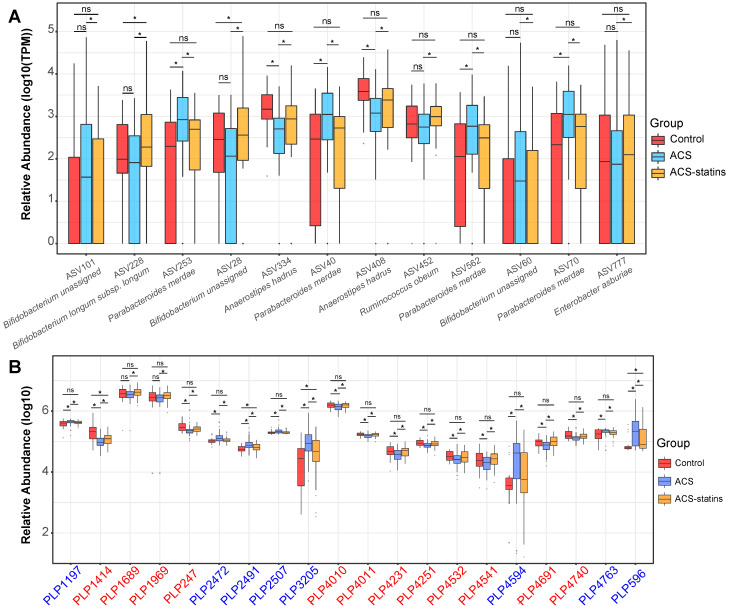
Figure 5.
Relative abundance of key statin-associated ASVs and metabolic features in different groups. (A) Changes in important statin-associated ASVs among the three groups. ns: not significant, *P < 0.05, FDR < 0.2, edgeR test. (B) Changes in important statin-associated metabolic features among the three groups. ns: not significant, *P < 0.05, Wilcoxon rank-sum test. The IDs of metabolic features are highlighted in red (statin-positive) and blue (statin-negative).

