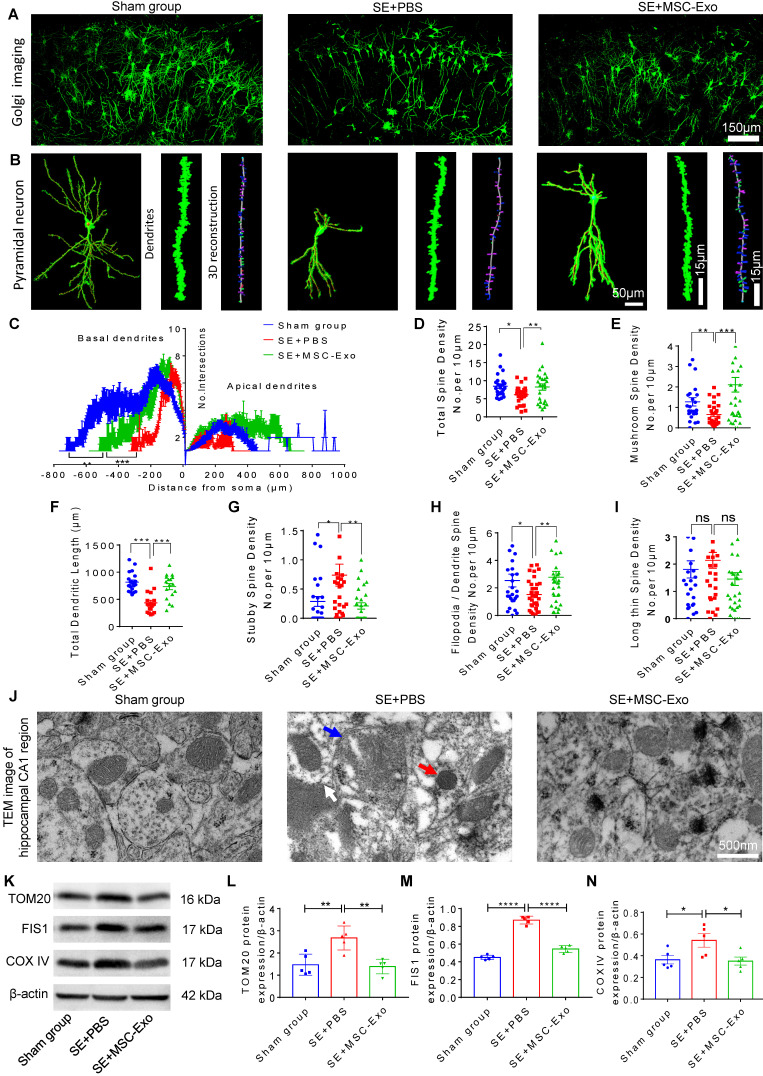
Figure 6.
Restoration of neuronal morphology alterations and mitochondrial changes by MSC-EVs in seizure mice. (A) Golgi imaging for the neuronal morphology in the experimental groups (n = 5 per group). Scale bar = 150 µm. (B) Representative images show the typical morphology (left), dendrites (middle), and 3D reconstruction of dendrites (right) in hippocampal pyramidal neurons of each group. Scale bar (left) = 50 µm, scale bars (middle, right) = 15 µm. (C) Statistical analysis for the dendritic complexity, including basal dendrites and apical dendrites among the experimental groups. (D-I) Quantification of the total spine density (D), mushroom spine density (E), total dendritic length (F), stubby spine density (G), filopodia/dendrite spine density (H), and long thin spine density (I) in hippocampal CA1 pyramidal neurons of each group. (J) Representative image shows the swelling of mitochondria (blue arrow) and their membrane (white arrow), and increased cristae density (red arrow) in hippocampal CA1 pyramidal neurons of each group. Scale bar = 500 nm. (K) Western blots of mitochondrial damage markers in hippocampal tissues of mice (K). (L-N) Statistical analysis for the TOM20 (L), FIS1 (M), and COX IV expression (N) in experimental groups (n = 5 per group). MSC-EVs: mesenchymal stem cell-derived extracellular vesicles; ns: no significance; n: number; TOM20: translocase of the outer mitochondrial membrane 20; FIS1: fission 1; COX IV: cytochrome c oxidase IV. * p < 0.05, ** p < 0.01, *** p < 0.001, **** p < 0.0001.

