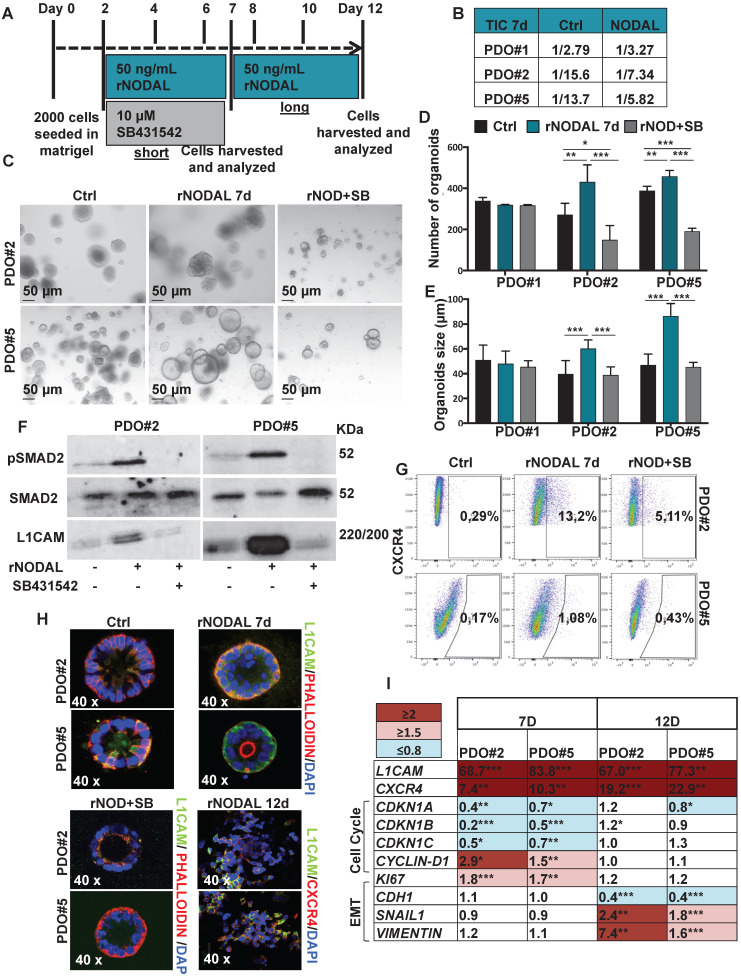
Figure 3.
Nodal induces L1CAM and CXCR4 expression in human CRC organoids. (A) Schematic illustration of PDOs treatment: human organoids were treated with rNODAL alone or in combination with SB431542 for 7 day (short treatment) or 12 days (long treatment). After stimulation molecular analysis was performed. (B) Tumor initiation frequency (TIC) of PDO#1, PDO#2 and PDO#3 treated or untreated for 7 days with rNODAL. (C) Representative images of PDO#2 and PDO#5 treated or untreated with rNODAL for 7 days in presence or absence of SB431542. (D) Organoids formation capacity of PDO#1, PDO#2 and PDO#5 treated or untreated with rNODAL for 7 days in presence or absence of SB431542. *p<0.05, **p<0.005, ***p<0.0005 compared with control. Data are mean ± SD, n (E) Quantification of organoids size in PDO#1, PDO#2 and PDO#5 treated or untreated with rNODAL for 7 days in presence or absence of SB431542. ***p<0.0005 compared with control. Data are mean ± SD, n
 (F) Western blot analysis of pSMAD2, SMAD2, and L1CAM in PDO#2 and PDO#5 treated or untreated with rNODAL for 7 days in presence or absence of SB431542. (G) Representative flow cytometry analysis for CXCR4 in PDO#2 and PDO#5 treated or untreated with rNODAL for 7 days in presence or absence of SB431542. All cytometry gates were established based on isotype controls. N
  (H) Confocal images for L1CAM (green), phalloidin (red), CXCR4 (red) and nuclei (blue, DAPI) of PDO#2 and PDO#5 treated or untreated with rNODAL for 7 and 12 days in presence or absence of SB431542. (I) qPCR analysis of L1CAM, CXCR4, cell cycle and EMT genes in PDO#2 and PDO#5 treated or untreated for 7 and 12 day with rNODAL. Data are normalized to PPIA expressionand are presented as fold change in geneexpression relative tountreated cells. *p<0.05, **p<0.005, ***p<0.0005. n≥6.

