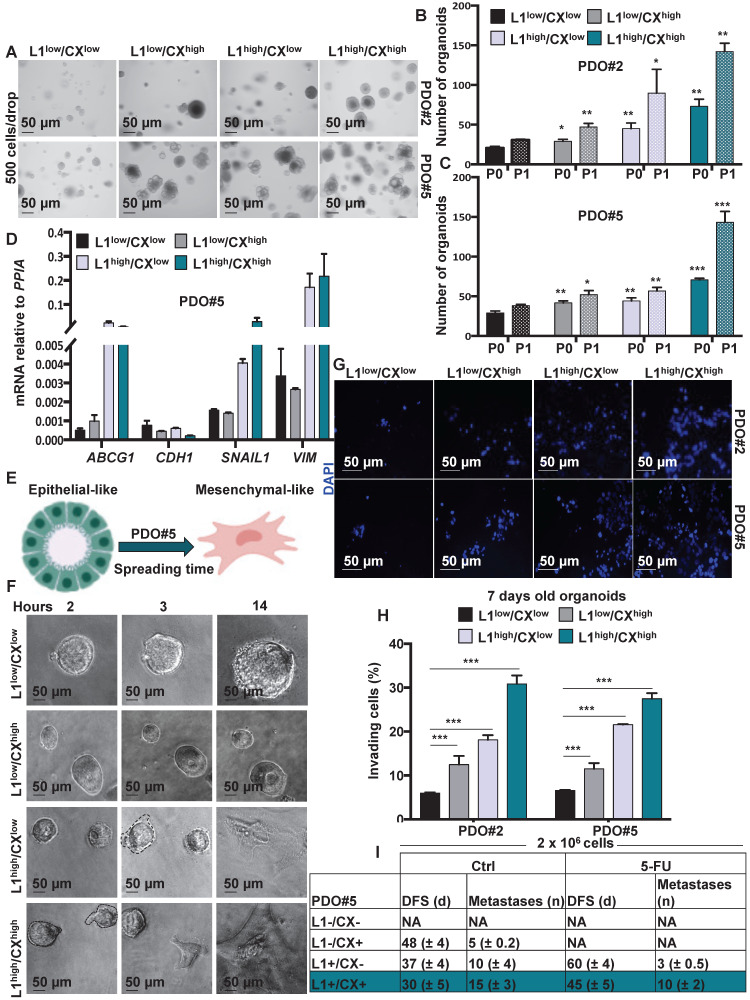
Figure 4.
Identification of migrating L1CAMhigh/CXCR4high subpopulation in CRC organoids. (A) Representative images of organoids derived from the four-sorted populations from PDO#2 and PDO#5. (B-C) Organoids formation capacity of the four-sorted populations from PDO#2 and PDO#5. P0 (passage 0): 7-days old organoids; P1 (passage 1): cells derived from P0 regrowth as organoids for additional 7 days. *p<0.05, **p<0.005, ***p<0.0005 compared with double low population. Data are mean ± SD, n≥6. (D) qPCR analysis for ABCG1, CDH1, SNAIL1 and VIM in the four sorted populations from PDO#5. Data are normalised to PP1A expression. Data are mean ± SD, n≥6. (E) Representative scheme of PDO spreading from epithelial-like to mesenchymal-like phenotype. (F) Representative images of the four-sorted populations from PDO#5 after 2, 3 and 14 h after plating. (G) Representative images of organoids invasion ability (boyden chamber assay) of the four sorted indicated populations from PDO#2 and PDO#5. (H) Invasive potential of the four sorted indicated populations from PDO#2 and PDO#5. ***p<0.0005. Data are mean ± SD, n≥6. (I) In vivodisease free survival (DFS) and number of metastasis of intrasplenically injected four sorted indicated populations from PDO#5. Data are mean ± SD, n ≥ 6.

