Figure 2.
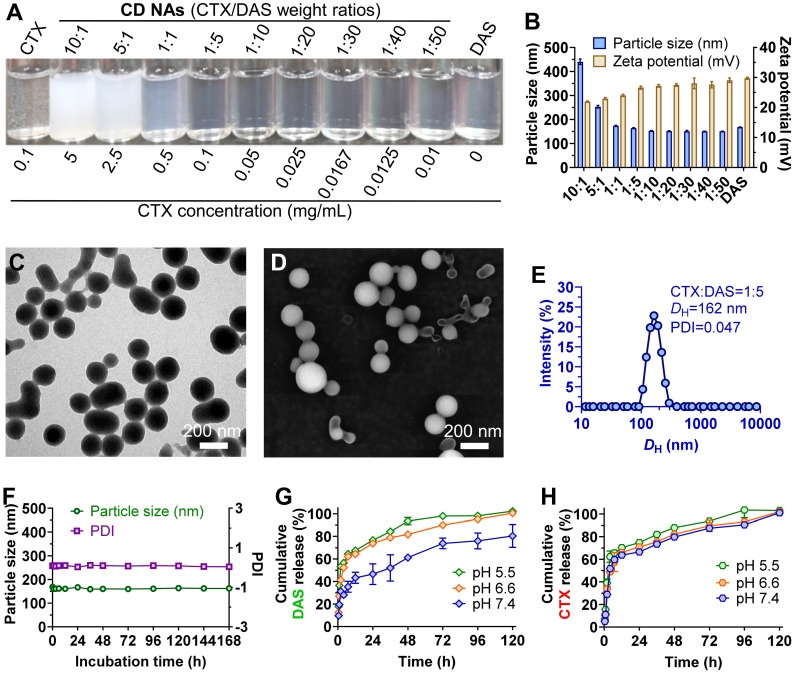
Characterization of self-assembled CD NAs. (A) Photograph of CD NAs fabricated at varying weight ratios of CTX to DAS. The nanoassemblies were prepared with a consistent DAS concentration at 0.5 mg/mL. The results indicate the formation of stable nanosuspensions. (B) A histogram of the particle size and zeta potential of CD NAs prepared at different weight ratios. (C) TEM and (D) SEM images of CD NAs (CTX/DAS, 1:5, w/w). Scale bars: 200 nm. (E) Size distribution of CD NAs determined by DLS analysis. The polydispersity index, PDI. (F) Variations in the particle size and PDI of CD NAs tested in PBS (pH 7.4, 10 mM). (G and H) In vitro release kinetics of DAS (G) and CTX (H) from CD NAs against PBS with different pH at 37 ℃. The data are presented as the means ± standard deviation (SD) of three independent experiments.

