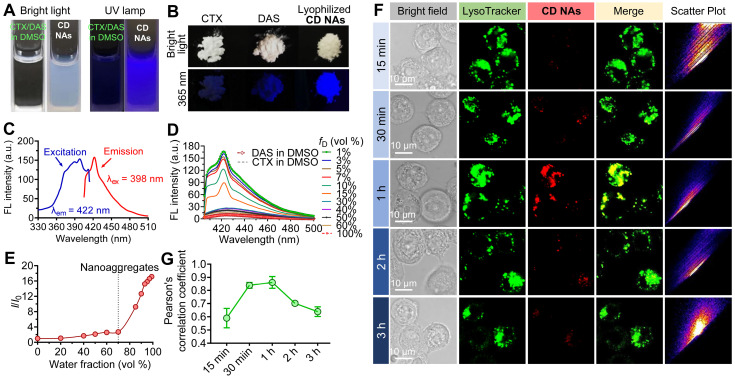
Figure 4.
The AIE characteristics of CD NAs. Photographs of (A) the CTX/DAS mixture in DMSO and CD NAs in 10% (v/v) DMSO aqueous solution and (B) the original solid powder of CTX, DAS and the lyophilized CD NAs, taken under bright light or 365 nm UV irradiation with a UV lamp. (C) Emission and excitation spectra of CD NAs in water. (D) Emission spectra of the CTX/DAS mixture in DMSO/water solutions with different DMSO fractions (fD). (E) Plot of the relative FL intensity (I/I0) of CD NAs versus the water/DMSO mixture, where I0 denotes the FL intensity of the CTX/DAS mixture in DMSO solution. (F) Confocal images of cellular uptake and colocalization of CD NAs (red) in NCI-H1975 cells. Commercially available LysoTracker Green DND-26 was used to stain endo/lysosomes (green). Scale bars: 10 µm. (G) Pearson's correlation coefficient analysis of colocalization between CD NAs and endo/lysosome markers over time by ImageJ. The data are presented as the means ±SD, quantified with 4 independent fields of view.

