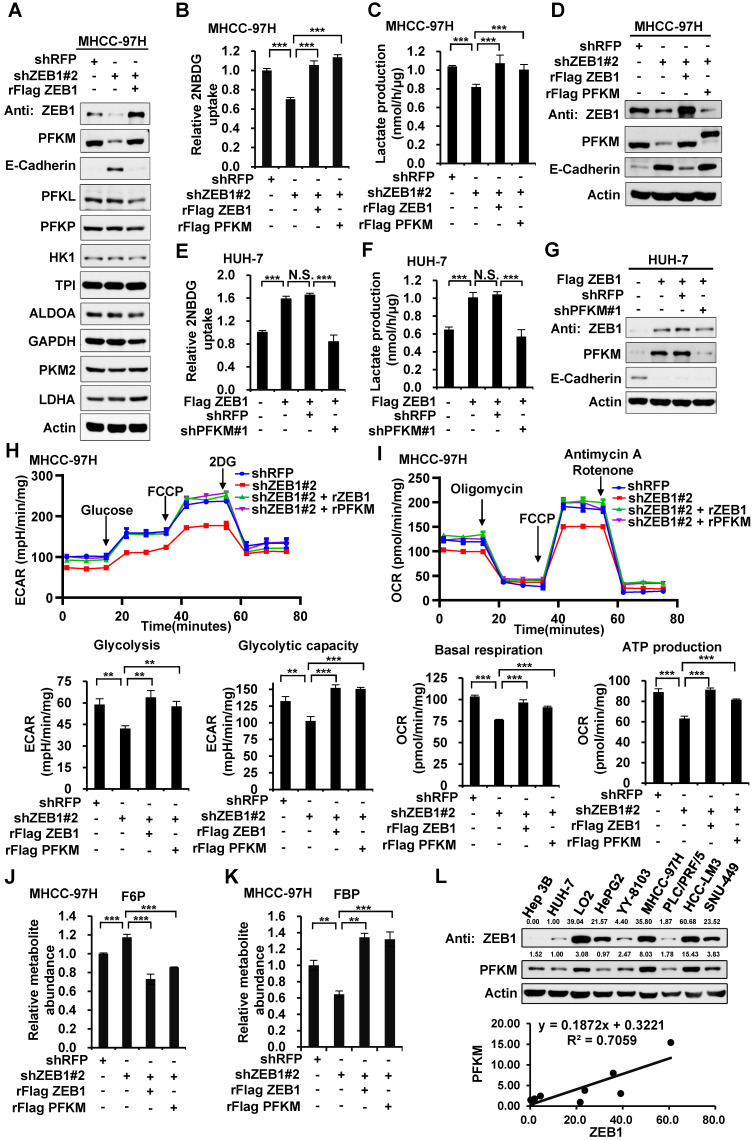
Figure 2.
ZEB1 stimulates glycolysis by upregulating PFKM. (A) Immunoblot of glycolysis enzymes in ZEB1 knockdown and re-expression MHCC-97H cell lines. (B-D) MHCC-97H cells were knocked down for ZEB1 and further expressed for exogenous ZEB1 or PFKM, followed by determination of glucose uptake (B), lactate production (C) and expression levels of indicated proteins (D). (E-G) HUH-7 cells with low endogenous expression of ZEB1 was overexpressed for Flag-tagged ZEB1 and further knocked down for PFKM, followed by measurement of glucose uptake (E), lactate production (F) and protein levels (G). (H) MHCC-97H cells used in (B) were detected for ECAR to indicate glycolysis flux and glycolytic capacity. (I) The OCR was detected to indicate basal respiration and ATP production. (J-K) Relative abundances of F6P (J) and FBP (K) in the same MHCC-97H cell lines as in (B) were measured using LC-MS. (L) The protein levels of ZEB1 and PFKM in a series of HCC cell lines were detected (upper panel) and analyzed for their correlation (lower panel). The data in (B-C, E-F and H-K) are shown as means±SD of three independent experiments and analyzed using Student's t test (**P<0.01, ***P<0.001, N.S.: P ≥ 0.05).

