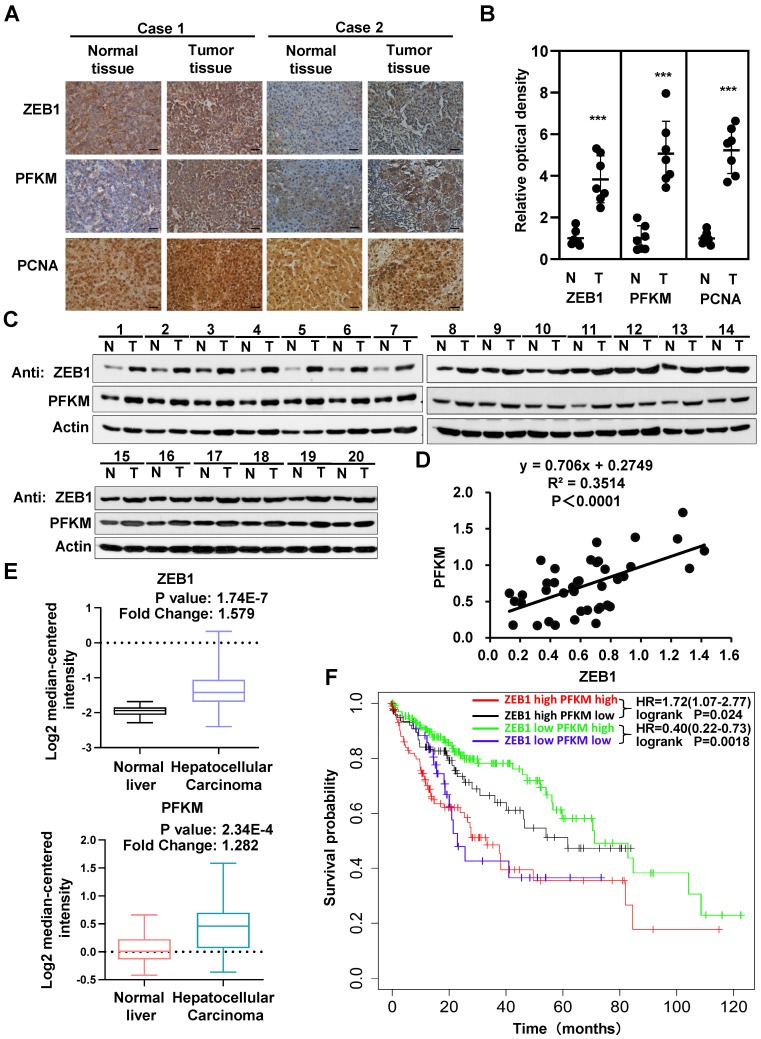
Figure 6.
Interrelated high expression of ZEB1 and PFKM is correlated with poor prognosis of HCC. (A-B) Representative pictures (A) and relative optical density of IHC staining of ZEB1, PFKM and PCNA in HCC tissues and the corresponding adjacent normal tissues (B). The scale bars represent 100 µm. The data are shown as means±SD (n=7, ***P <0.001, Student's t test). (C-D) The protein levels of ZEB1 and PFKM in HCC tissues and the corresponding adjacent normal tissues (n=20) were determined using Western blot (C), followed by analysis of their correlation (D). (E) The comparison of either ZEB1 (upper panel) or PFKM (lower panel) expression between normal liver tissues and HCC tissues. Data are publicly available in Oncomine (the MAS liver). (F) The Kaplan-Meier curves of overall survival basic relating to ZEB1-PFKM axis in HCC. Data are publicly available in the Kaplan-Meier Plotter.

