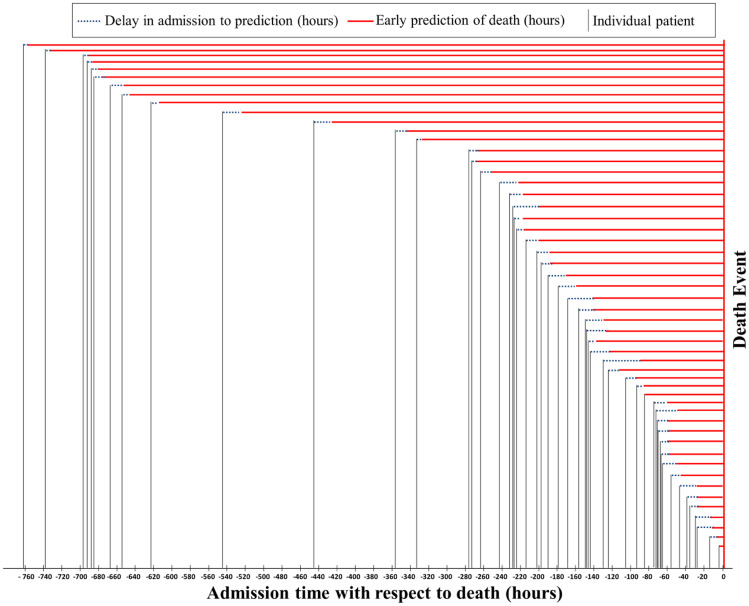
Fig. 8.
Estimation of the prediction of the patients’ outcome for 52 test patients with death outcome. The model was trained on the data present at admission, and multiple samples from a patient were used to predict the patient to be in high-risk group in the earliest time after admission. Note: “0” denotes the death outcome event for each patient, and vertical lines represent the time of admission with respect to death. Solid red line starts from the earliest prediction time point of death prediction, and the dotted line represents the delay between admission and death prediction by the model using the LNLCA model

