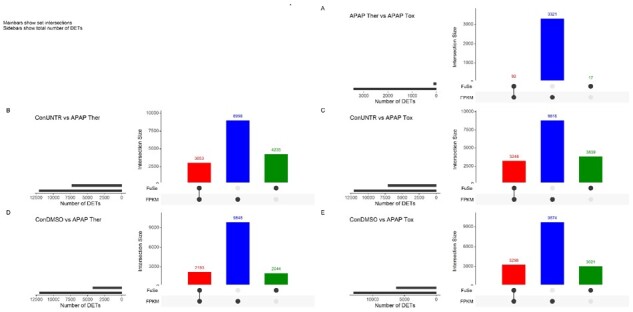
Fig. 3.

Comparison of DETs. Change in DETs (basemean > 10 and Pval < 0.01 and |log2FC|> 1) obtained from FPKM and FuSe expression. The DETs were calculated using DESeq2 and the plots were made using UpSetR package (Conway et al., 2017) in R. (A) Ther versus Tox, (B) ConUNTR versus Ther, (C) ConUNTR versus Tox, (D) ConDMSO versus Ther and (E) ConDMSO versus Tox. The red bars show overlapping DETs, blue and green bars show exclusive DETs from original FPKM and recalculated expression, respectively
