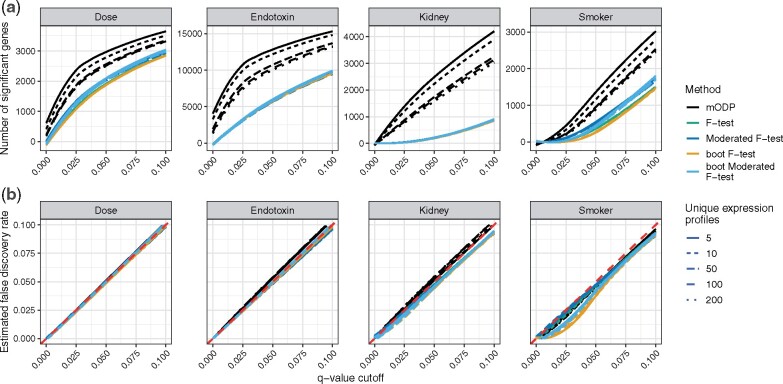
Fig. 6.
Simulation results for the dose, endotoxin, kidney and smoker studies using 5, 10, 50, 100 and 200 unique gene expression profiles (linetype). The mODP (black), F-test (green), moderated F-test (blue), bootstrap F-test (orange) and bootstrap moderated F-test (light blue) are applied to the simulated studies. (a) Estimated power at multiple q-value cutoffs between 0.0001 and 0.1. (b) Estimated FDR. Curves represent the average value from 500 replications

