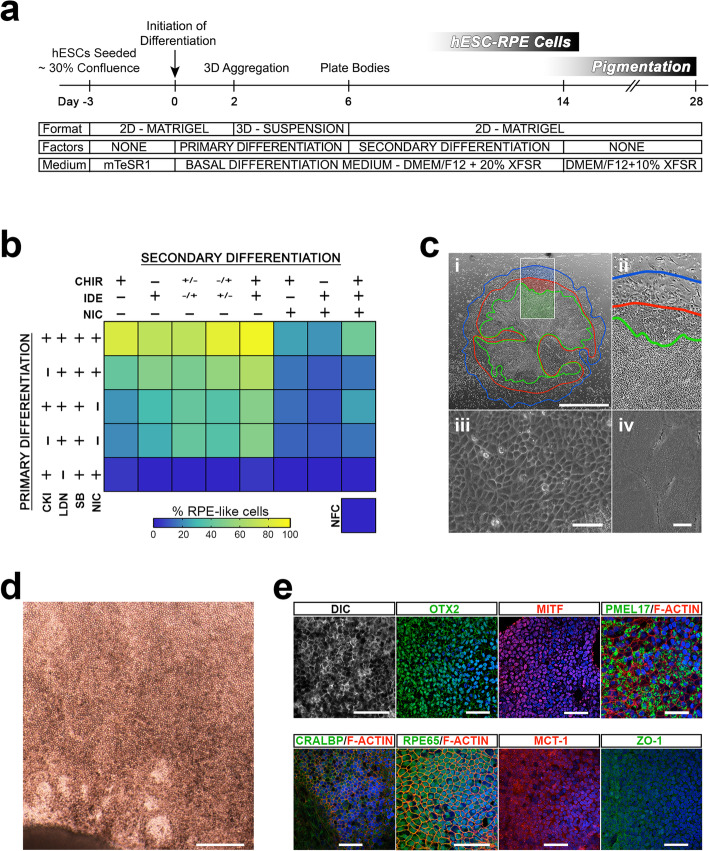
Fig. 2.
Optimization of differentiation by small molecule exclusion assay. The procedure for plating cells, managing embryoid bodies, and then replating cells was optimized to obtain maximal outgrowth of differentiated cells by 14 days. a Schematic of cell differentiation, including details of physical manipulation, timing, substrate, medium and signaling. b Schematic of different factors and their combinations to develop an optimized differentiation protocol. (+) present, (−) absent, (+/−) days 7–9, (−/+) days 10–14. Morphological analysis was used to calculate outgrowth of cells with early RPE morphology as percentage of total cells. NFC no factor controls. c Cells grown under the best small molecule conditions of CKI/LDN/SB/NIC (primary) followed by CHIR/ IDE (secondary). A representative body is shown at day 16 with contours demarcating zones of cells with different morphology. Scale = 1000 μm. The green zone identifies cells with classical RPE cell morphology, the red zone demarcates outgrowth of more fibroblastic cells and the blue zone shows the leading edge of the body (i, ii). Phase contrast microscopy shows cells at day 16 in the green zone with typical early RPE cell morphology (iii). Scale = 50 μm. SEM shows immature hESC-RPE cells without microvilli (iv). Scale = 2 μm. d After 28 days of growth, cell monolayers under phase microscopy reflect uniformly pigmented, polygonal RPE cells. Scale = 200 μm. e Differential interference contrast (DIC) microscopy shows dark pigmentation of in vitro matured hESC-RPE cells. Immunofluorescent staining shows expression of key RPE cell transcription factors (OTX2 and MITF), pre-melanocyte marker (PMEL17), visual cycle proteins (CRALBP and RPE65), and mature RPE cell markers (MCT-1 and ZO-1). Phalloidin stained F-actin identifies cell boundaries. Hoescht33342 was used to stain nuclei. Scale = 50 μm

