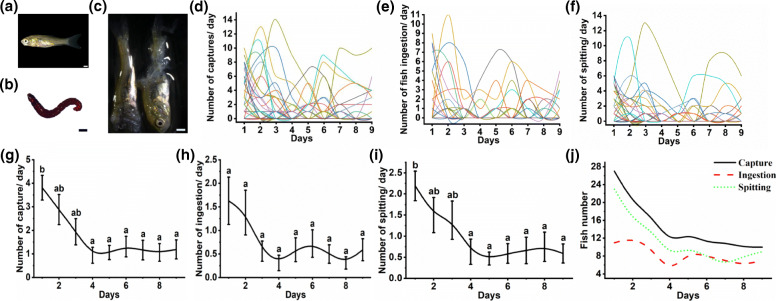
Fig. 5.
The changes of the related indicators of foraging fish in hybrid fish with time. a Small fish (C. auratus). b Blood worms (Chironomidae larvae). c Small fish debris. d The trends of captures of every SP with time. e The trends of ingestion of every SP with time. f The trends of spitting of every SP with time. g The mean trend of captures of SP with time. h The mean trend of ingestion of SP with time. i The mean trend of spitting of SP with time. j The trends in the number of SP involved in capture, ingestion and spitting. In d, e and f, each line represents an individual. The scale of all figures is 1 mm. The different superscripts a, b above the lines differ significantly at P < 0.05 based on Tukey test, and whiskers indicate mean ± SE

