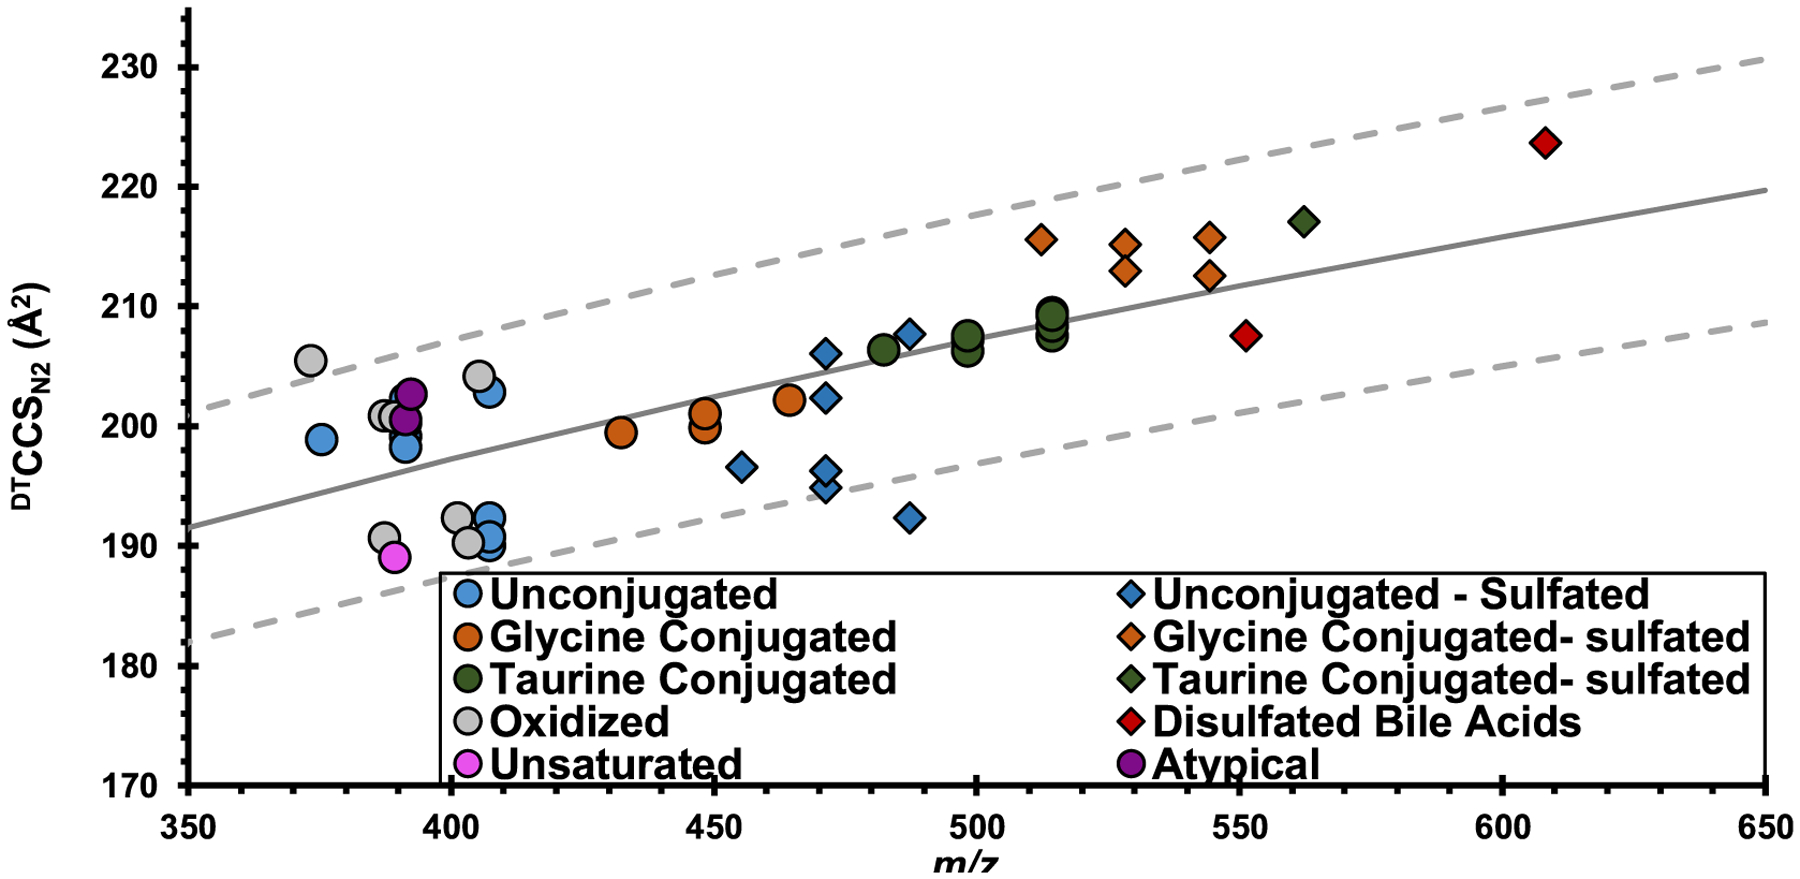
Figure 3.

Conformational space DTCCSN2 vs m/z plot of the [M − H]− ion of 47 bile acid standards in negative ionization mode. Marker color indicates the bile acid subclass. Unsulfonated bile acids are represented by circles, while sulfonated bile acids are denoted by diamonds. The solid gray line represents the bile acid trendline for all species, and the dotted lines depict the bounds of the 95% confidence interval. All but two bile acids values fell within this correlation, regardless of conjugation and sulfonation.
