Fig. 2.

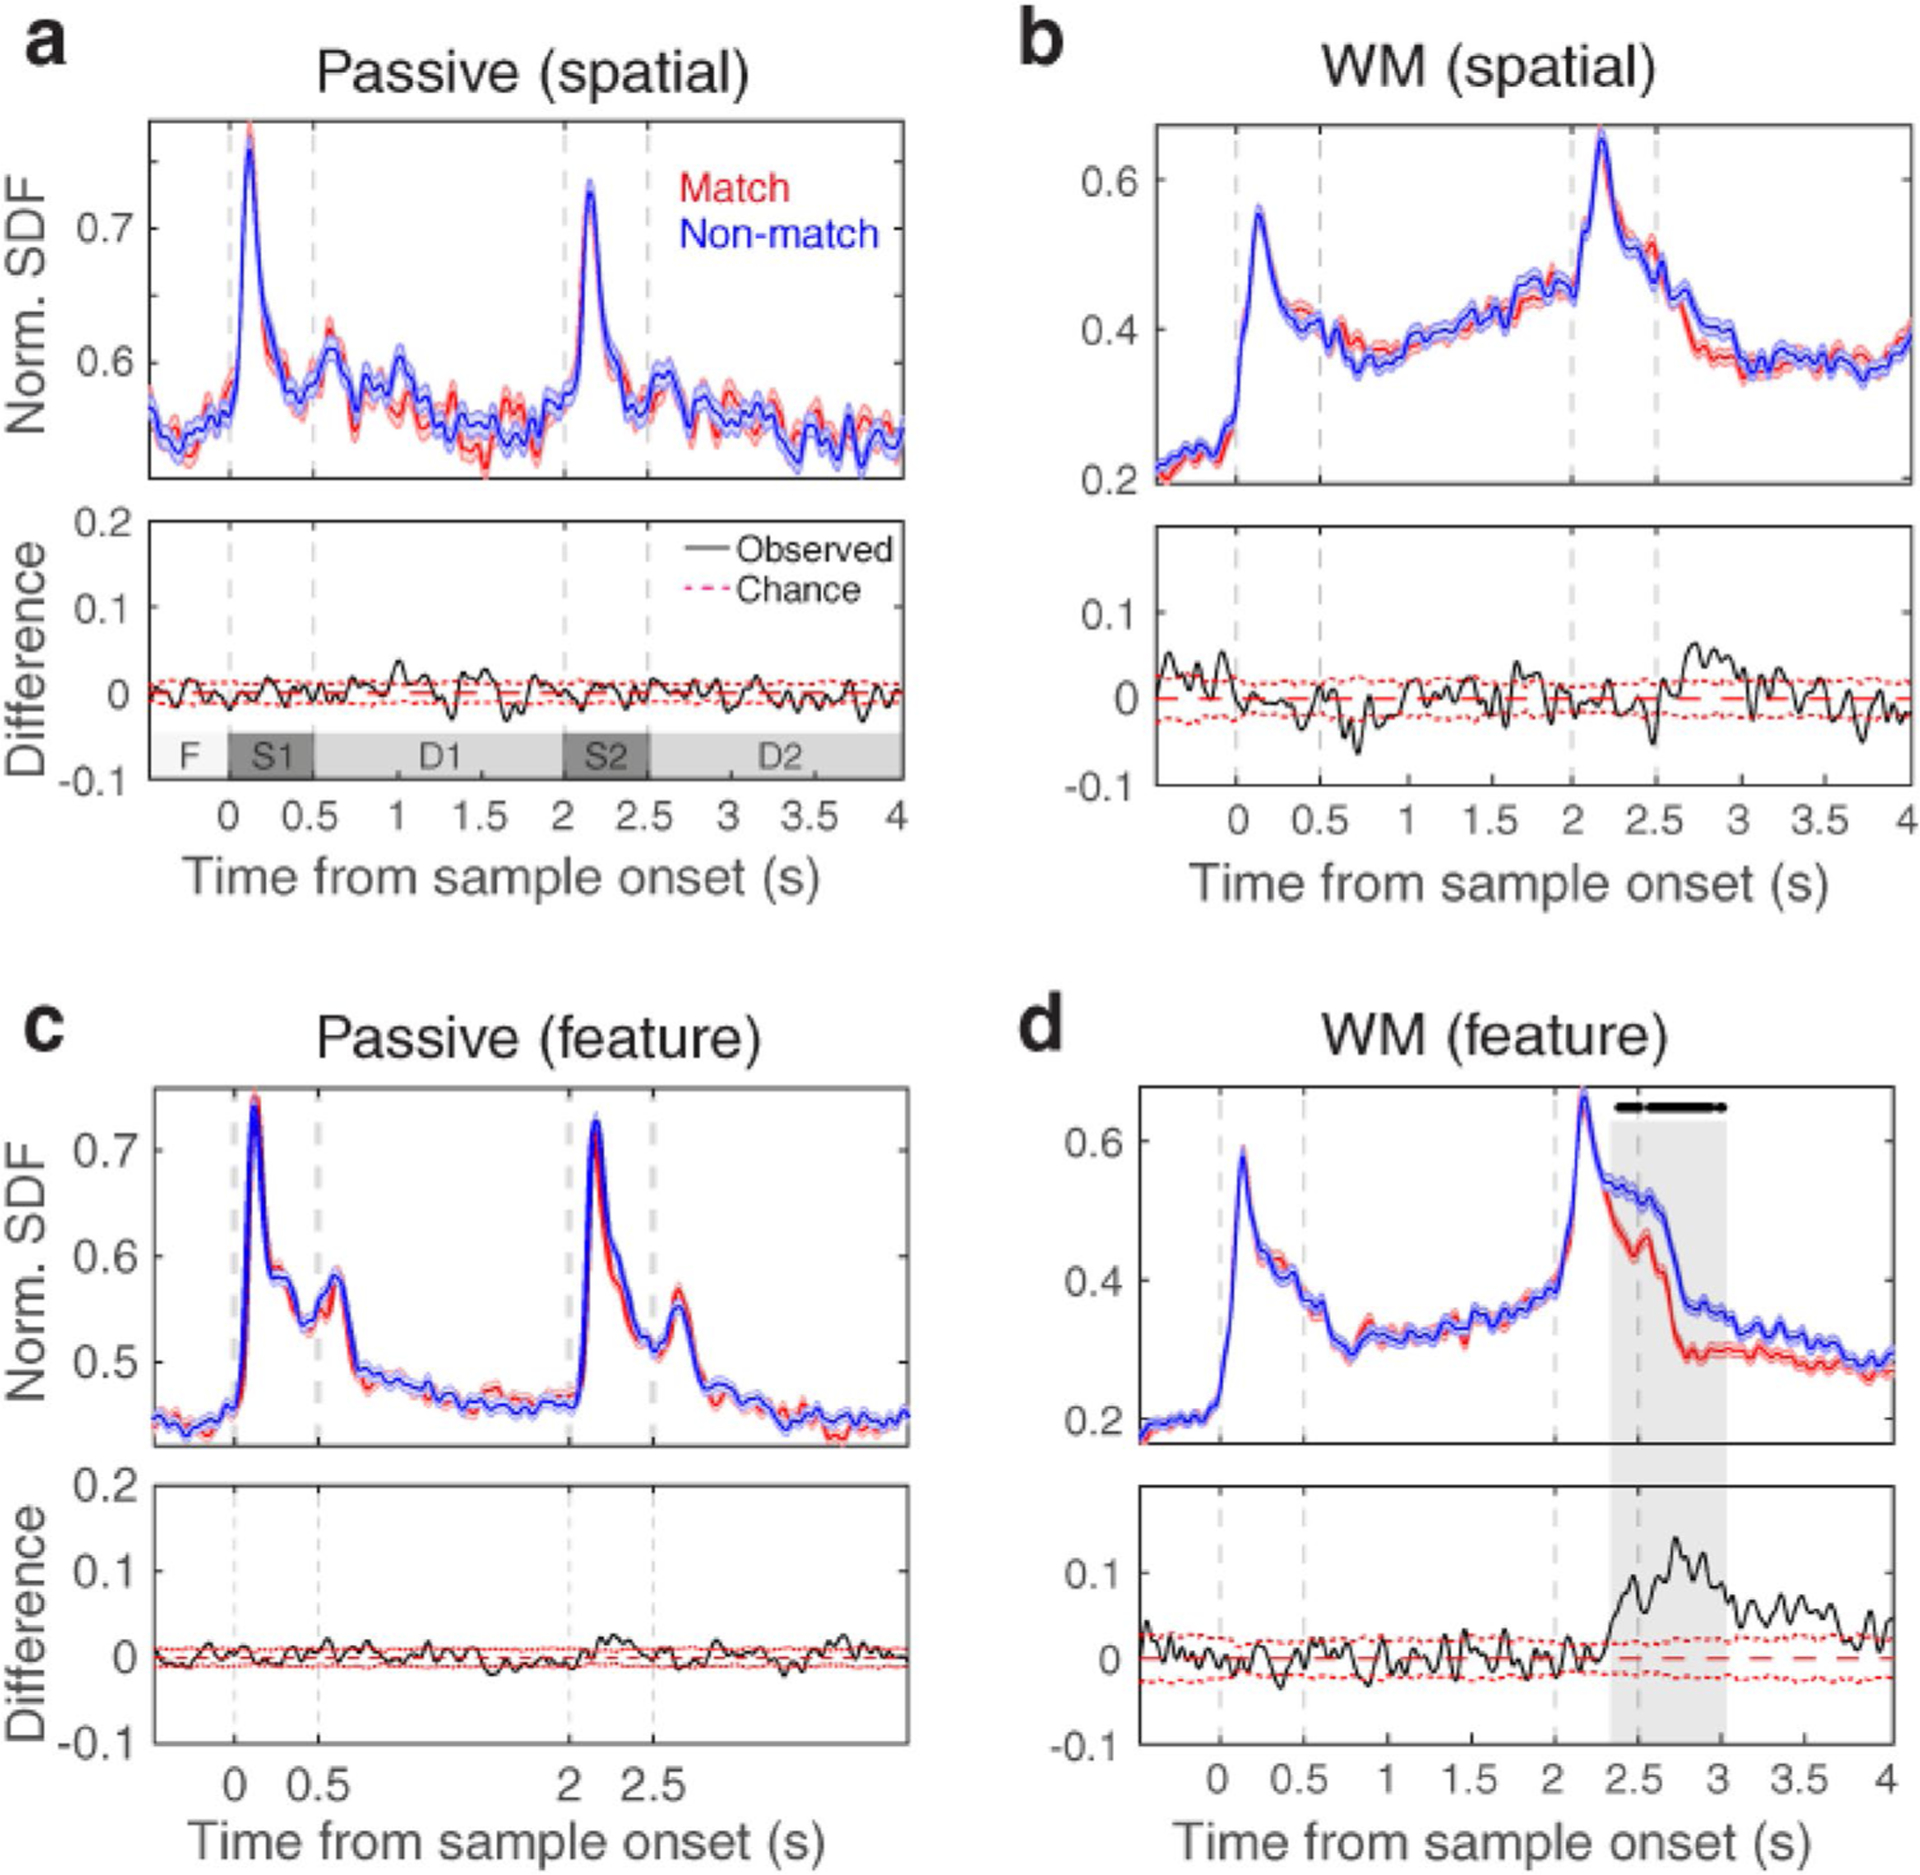
Matching-rule decision-making modulates the PFC neural activity in the feature WM task. The top panels show the average spiking activity (based on SDF) during − 0.5 to 4 s relative to the sample stimulus onset (F fixation, S1 sample stimulus, D1 1st delay, S2 test stimulus, D2 2nd delay). They exhibit the neural responses of the match (red line) and non-match (blue line) conditions within spatial passive (a), spatial WM (b), feature passive (c), and feature WM (d) tasks. Black dots on top of the SDFs indicate the time points with a significant difference between the population response of match and non-match conditions. The differences between average responses of the match and non-match conditions were displayed in the lower panels. Gray dashed lines show the period of sample and test stimuli presentation. Red dashed lines indicate the standard error from the mean (SEM) of the chance distribution
