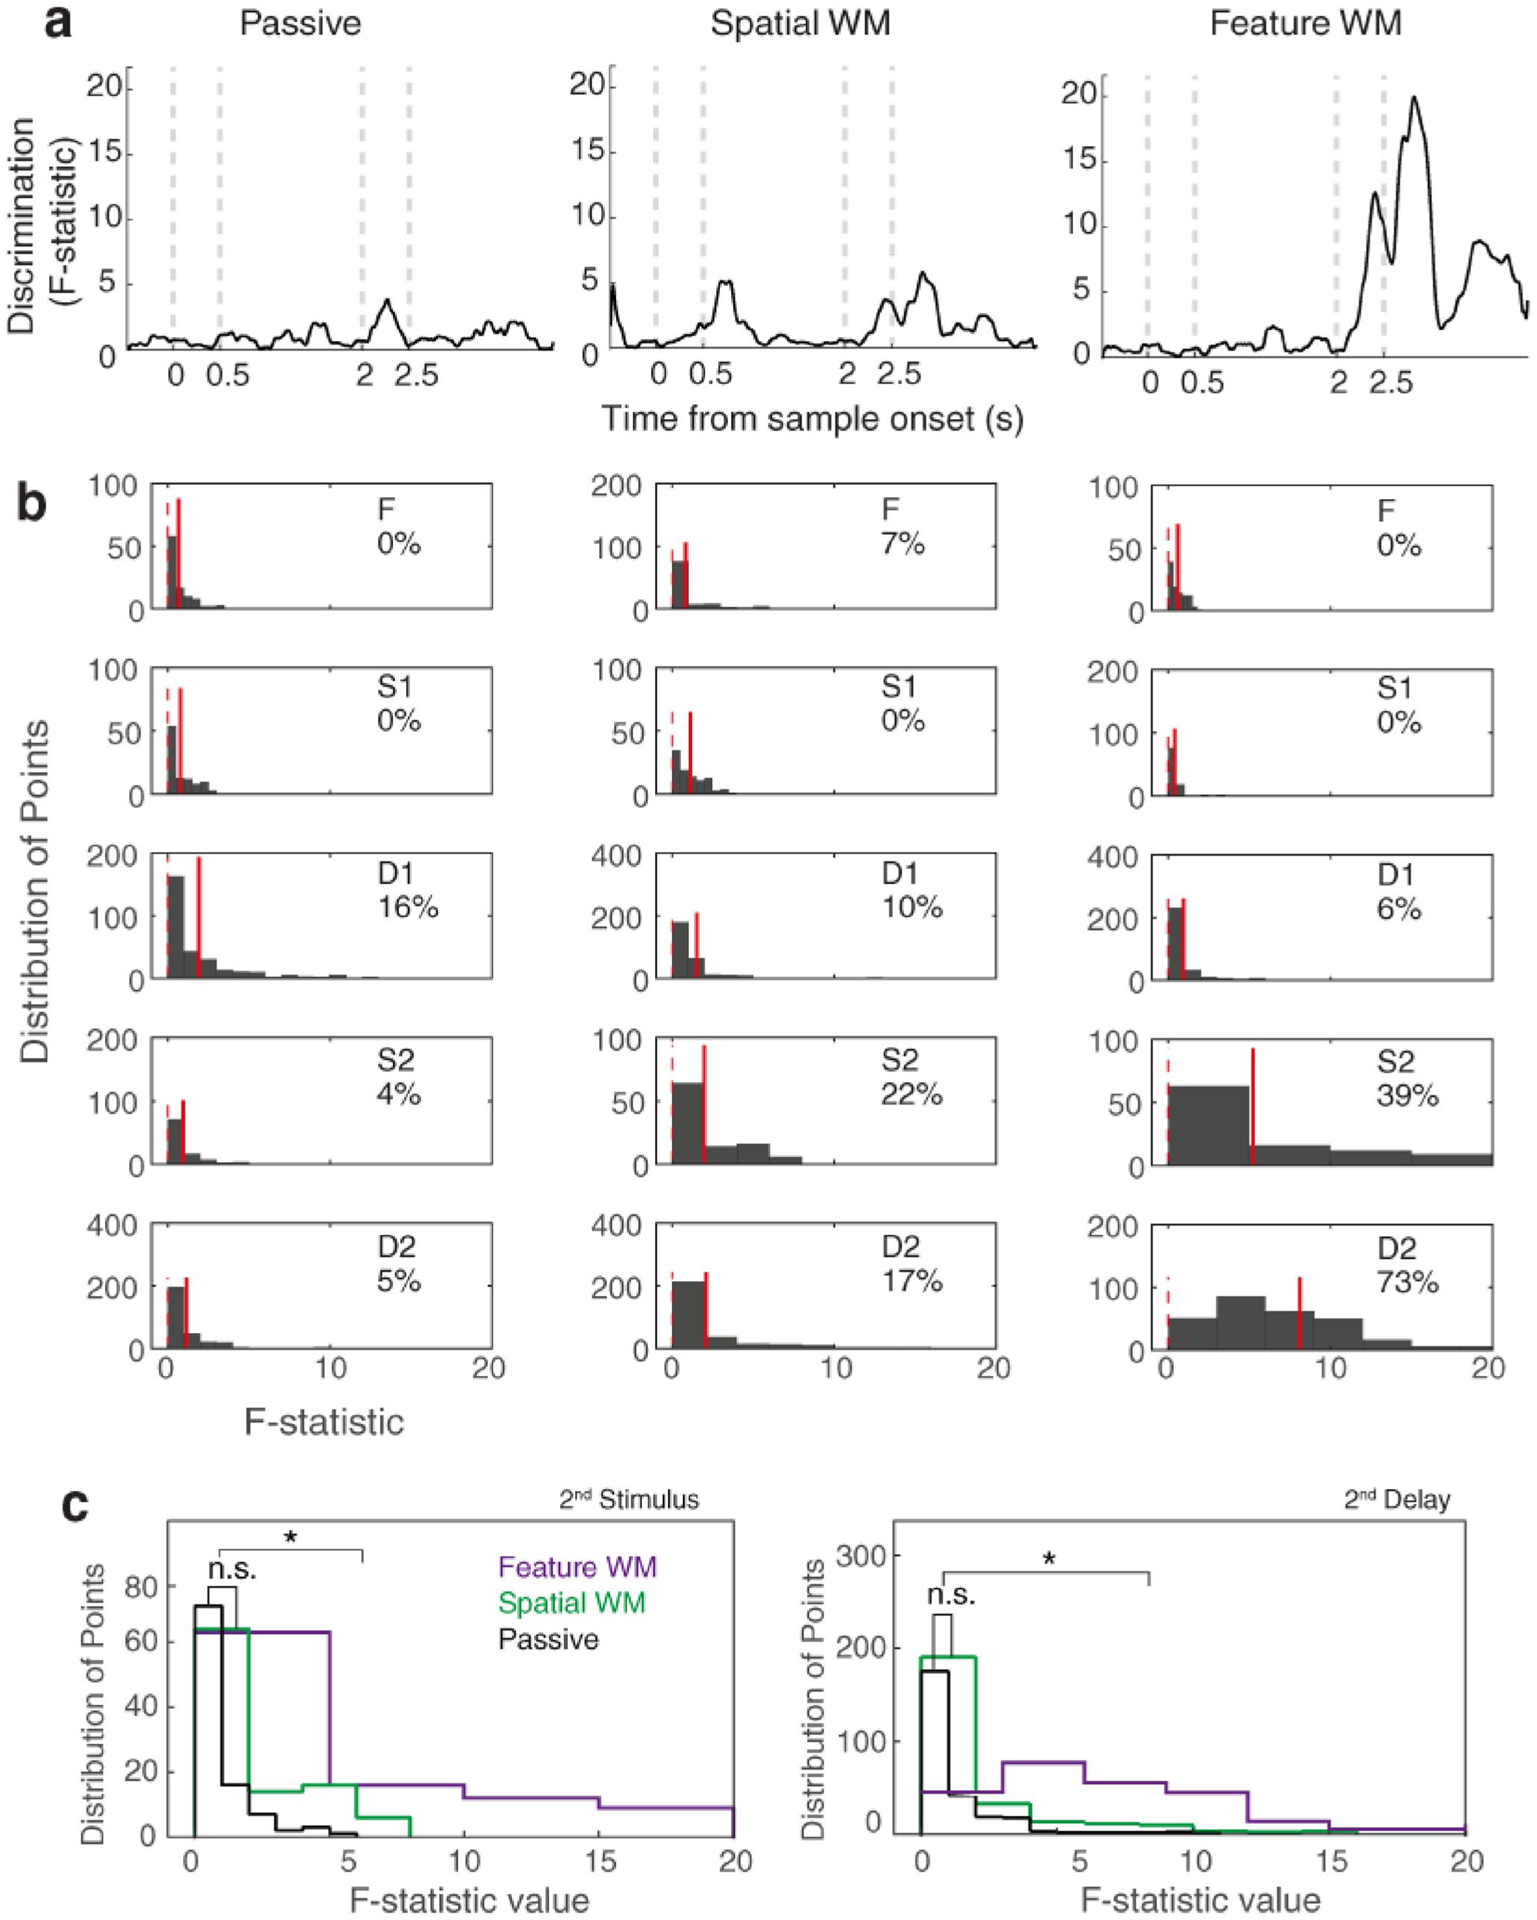
Fig. 3.

Matching-rule modulation arises during the late test period and its following delay interval. a Time-course of discrimination between firing rate response of match and non-match conditions based on F-statistic values obtained by ANOVA across the population of neurons (left: passive, middle: spatial WM, and right: feature WM). b Histogram of the F-statistic values of each epoch in the passive and WM tasks, separately (F fixation, S1 sample stimulus, D2 1st delay, S2 test stimulus, D2 2nd delay). The integers represent the percentage of points with significant selective responses for matching conditions. Red solid lines show the mean F-statistic in each epoch and indicate the distance of the mean selectivity value from zero (red dashed lines). c Statistical comparisons between the histograms of the three tasks during test stimulus interval (left panel) and its following delay period (right panel). Notation ‘ns’ denotes non-significant effect and *Shows significant effect
