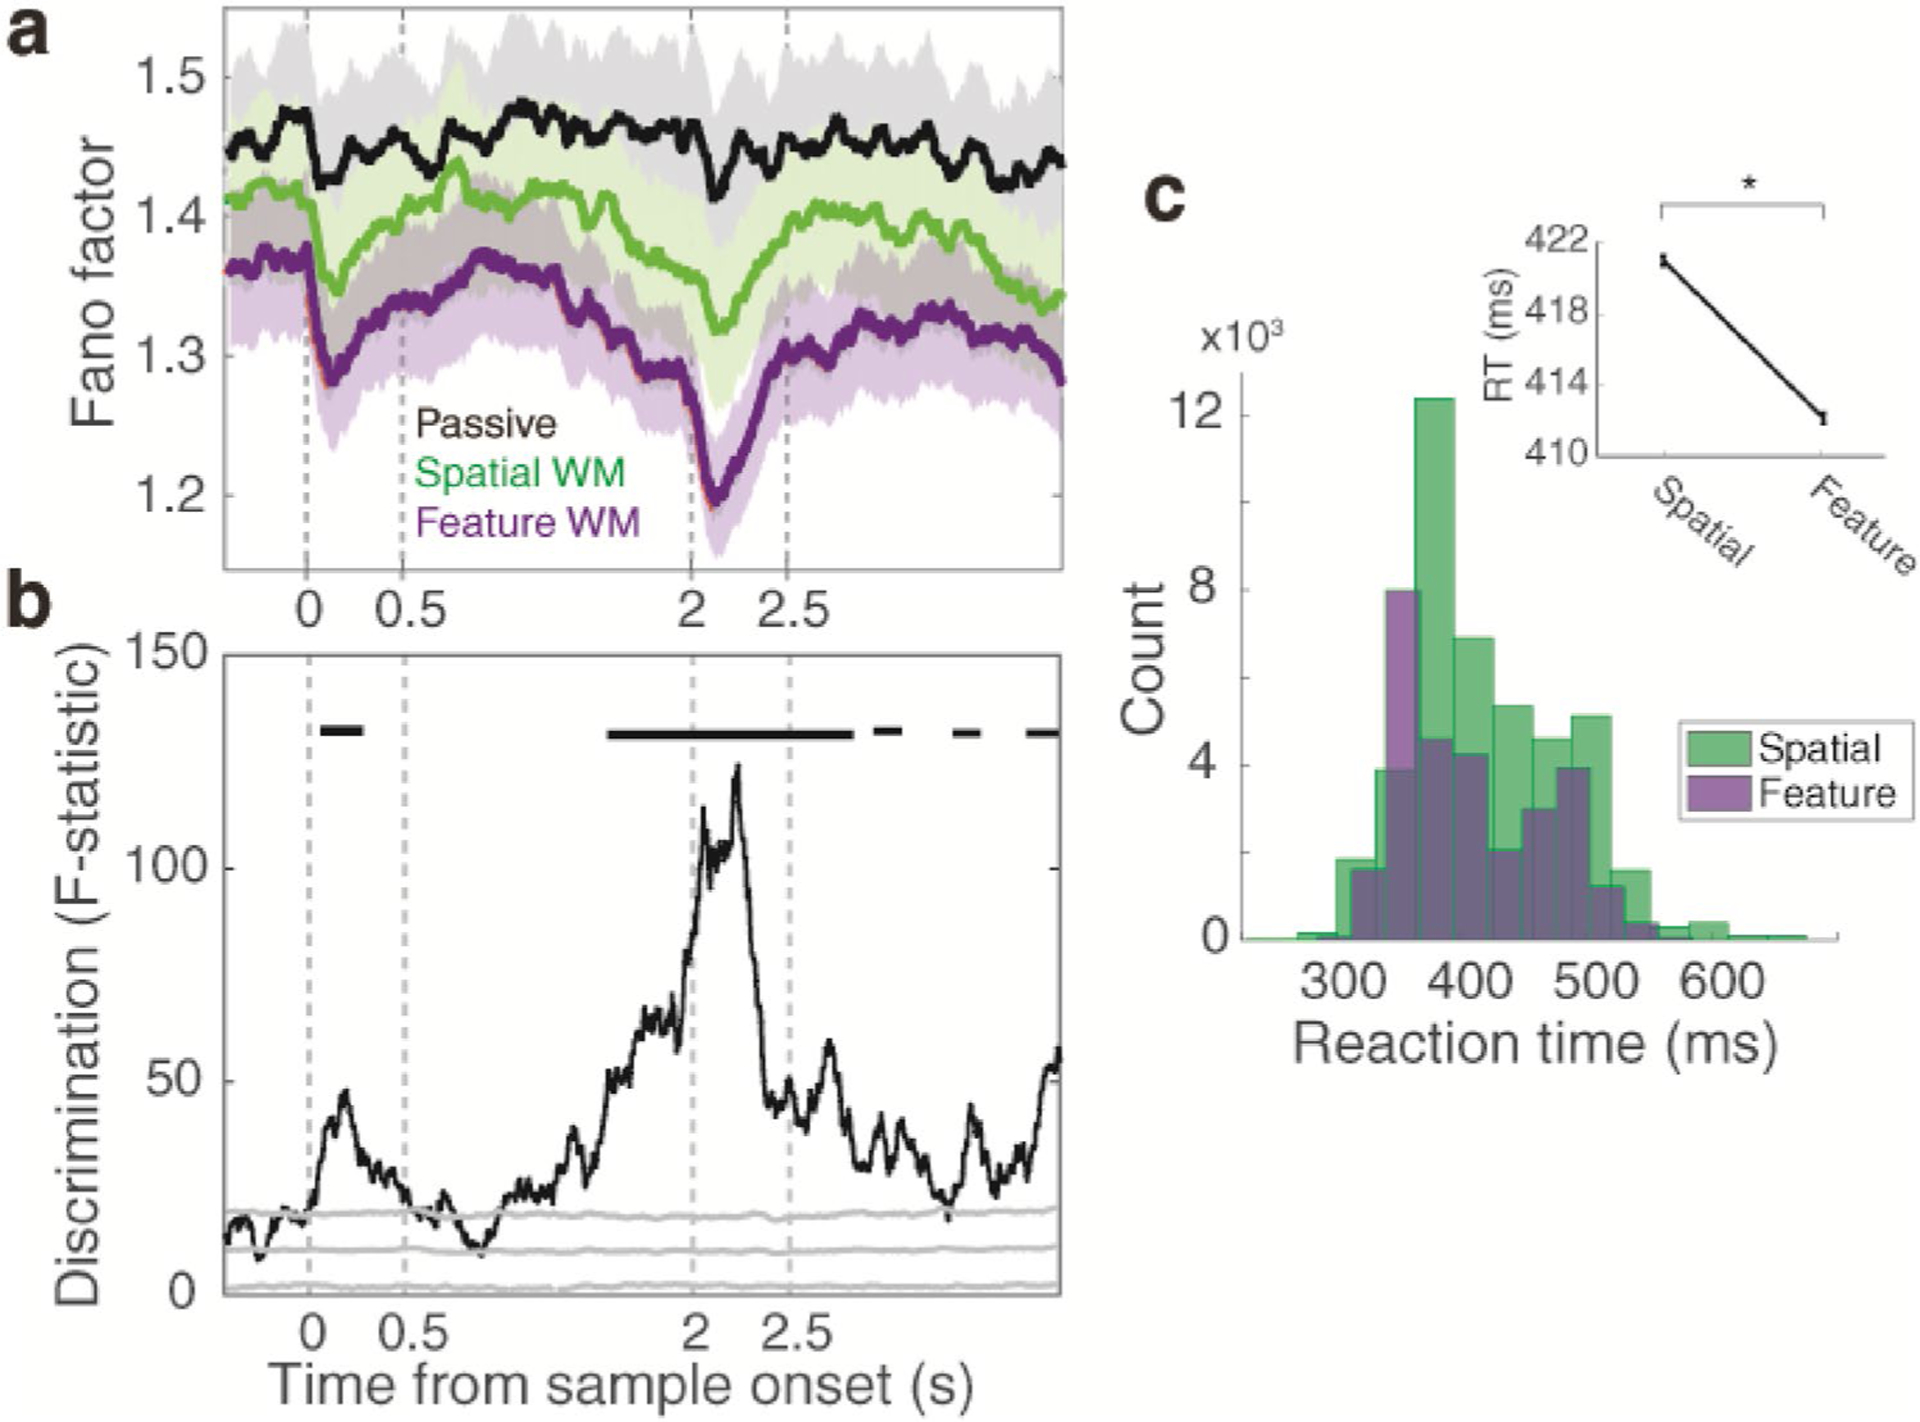
Fig. 5.

The different discriminability of WM tasks is due to their differential attentional level. a Mean Fano factor throughout the passive (black line), spatial WM (green line), and feature WM (purple line) tasks. Shaded lines display the standard error of the mean (SEM) across all neuron conditions. b Discrimination strength between the Fano factors of the three tasks. The gray solid line denotes the chance level of the null distribution. Black horizontal lines show the time intervals with a significant discrimination effect. c Distribution of reaction times (RT) in two WM tasks. The inset plot shows the significant difference in behavioral reaction times between the two WM tasks
