Figure 3.
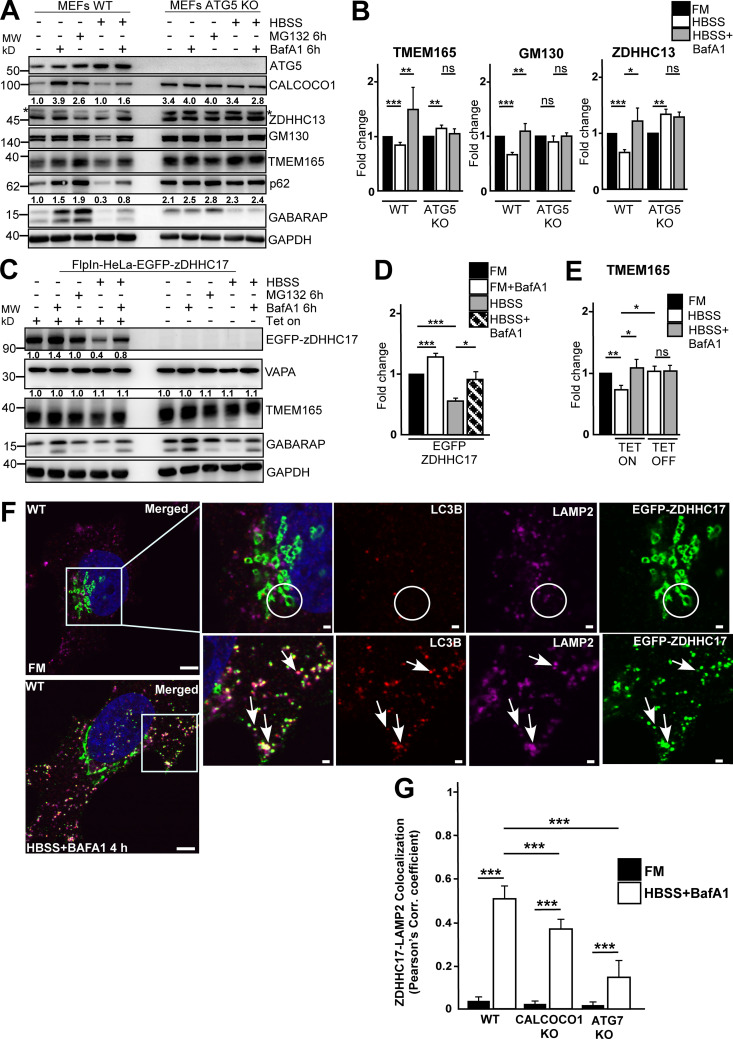
ZDHHC17 promotes degradation of Golgi by autophagy during starvation. (A and B) MEF parental and Atg5 KO cells were left untreated, treated with Baf A1 for 6 h or MG132 for 6 h, or starved for 6 h with or without Baf A1. Cell lysates were analyzed by immunoblotting with the indicated antibodies. In A, the panels are collected from more than one Western blot experiment, but for clarity, only a single GAPDH loading control is shown. Numbers below the blots represent relative intensity of the bands in the blots shown, normalized against loading control. The asterisks (*) indicate unspecific bands. The bars in B represent the mean ± SD of band intensities relative to the loading control from three independent experiments quantified using ImageJ. Statistical comparison was analyzed by one-way ANOVA followed by Tukey multiple comparison test. Significance is displayed as ***, P < 0.001; **, P < 0.005; *, P < 0.01. (C–E) HeLa cells stably expressing tetracycline-inducible EGFP-ZDHHC17 were left uninduced or induced for 48 h and then treated as in A. Cell lysates were analyzed by immunoblotting with the indicated antibodies. Numbers below the EGFP-ZDHHC17 blot represent relative intensity of the bands normalized against the loading control. Data in D and E are presented as mean ± SD of three independent experiments. Statistical comparison was analyzed as in B; significance is displayed as ***, P < 0.001; **, P < 0.005; *, P < 0.01. (F) HeLa WT cells were transfected with EGFP-ZDHHC17; 24 h after transfection, were either left untreated or starved (HBSS) for 4 h with Baf A1 treatment, then immunostained for endogenous LC3B and LAMP2. The arrows point to colocalization. Bars represent 5 µm (main) and 1 µm (insets). (G) Colocalization analysis of EGFP-ZDHHC17 and LAMP2 in WT HeLa cells analyzed in F, CALCOCO1 KO cells analyzed in Fig. S1 D, and ATG7 KO cells analyzed in Fig. S2 D. The error bars represent mean ± SEM of three independent experiments per condition with 100 cells per experiment. Statistical comparison was analyzed by one-way ANOVA followed by Tukey multiple comparison test. Significance is displayed as ***, P < 0.001. MW, molecular weight.

