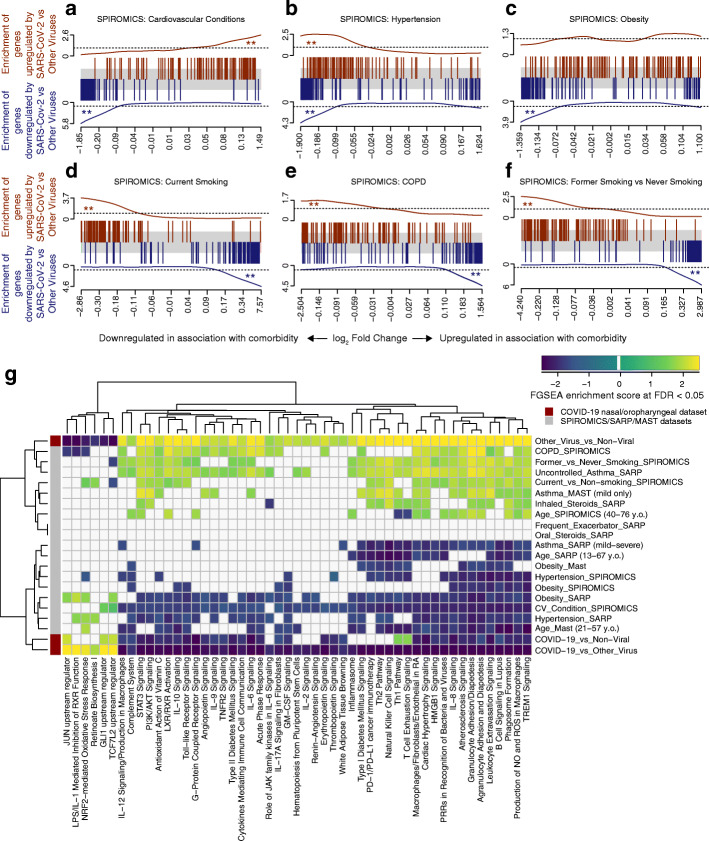
Fig. 3.
COVID-19-related gene set enrichment analyses in association with comorbidities. a–f Barcode plots in which the vertical lines represent the 100 genes most upregulated (red) or downregulated (blue) in nasal/oropharyngeal swab samples obtained from COVID-19 patients as compared to other viruses at the time of diagnosis of an acute upper respiratory infection. These gene sets are plotted against log fold gene expression changes arranged from most downregulated to most upregulated with that comorbidity (horizontal gray bar). Lines above (red) and below (blue) the bar represent the running sum statistic with a significant finding indicated when the line crosses the dashed line at either end of the plot. Genes downregulated by SARS-CoV-2 infection compared to other viruses were significantly enriched amongst genes downregulated in association with cardiovascular conditions overall (a), hypertension (b), and obesity (c), while in current (d) and former smoking (f) and in COPD (e), these downregulated genes in COVID-19 were enriched amongst upregulated genes in association with comorbidity. ** indicates FDR < 0.05. g COVID-19-related pathway gene sets were generated from an IPA analysis of the genes downregulated by SARS-CoV-2 infection compared to other viruses. Gene set enrichment scores for gene sets enriched at FDR < 0.05 (columns) are shown in the heatmap plotted against comorbidities (rows) with gene sets enriched amongst downregulated and upregulated genes indicated in blue and yellow, respectively. All pathways not enriched at FDR < 0.05 were shrunk to zero (white). Euclidean distance with average linkage was used for clustering

