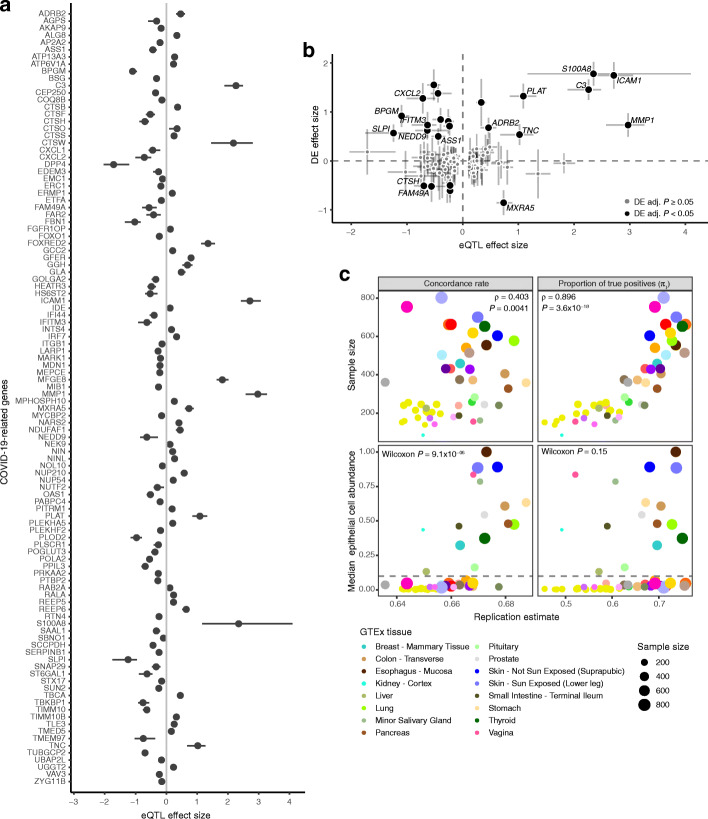
Fig. 4.
Cis-eQTLs in bronchial epithelium. a Effect size measured as allelic fold change (aFC, log2) of the significant cis-eQTLs for COVID-19 candidate genes. Error bars denote 95% bootstrap confidence intervals. b Comparison of the regulatory effects and the effect of SARS-CoV-2 infection on the transcription of COVID-19 candidate genes in normal bronchial epithelial cells from Blanco-Melo et al. [30]. The graph shows regulatory effects as aFC as in a and fold change (log2) of differential expression comparing the infected with mock-treated cells with error bars denoting the 95% confidence interval. Genes with adjusted P value < 0.05 in the differential expression analysis are colored in black, genes with non-significant effect are colored in gray. Highlighted genes have eQTL effect size greater than 50% of the differential expression effect size on the absolute scale. DE—differential expression. c Replication of cis-eQTLs from bronchial epithelium in GTEx v8 using the concordance rate (proportion of gene-variant pairs with the same direction of the effect, left panel) and proportion of true positives (π1, right panel). Upper panel shows the effect of sample size on the replication and concordance measures quantified as Spearman correlation coefficient (ρ). Lower panel shows the replication and concordance measures as the function of epithelial cell enrichment of the tissues measured as median epithelial cell enrichment score from xCell. Gray dashed line denotes median enrichment score > 0.1, which classifies tissues as enriched for epithelial cells. Wilcoxon rank sum test was used to estimate the difference in replication estimates between tissues enriched or not enriched for epithelial cells. The 16 tissues enriched for epithelial cells are outlined in the figure legend, for the full legend see Additional file 3: Figure S9a

