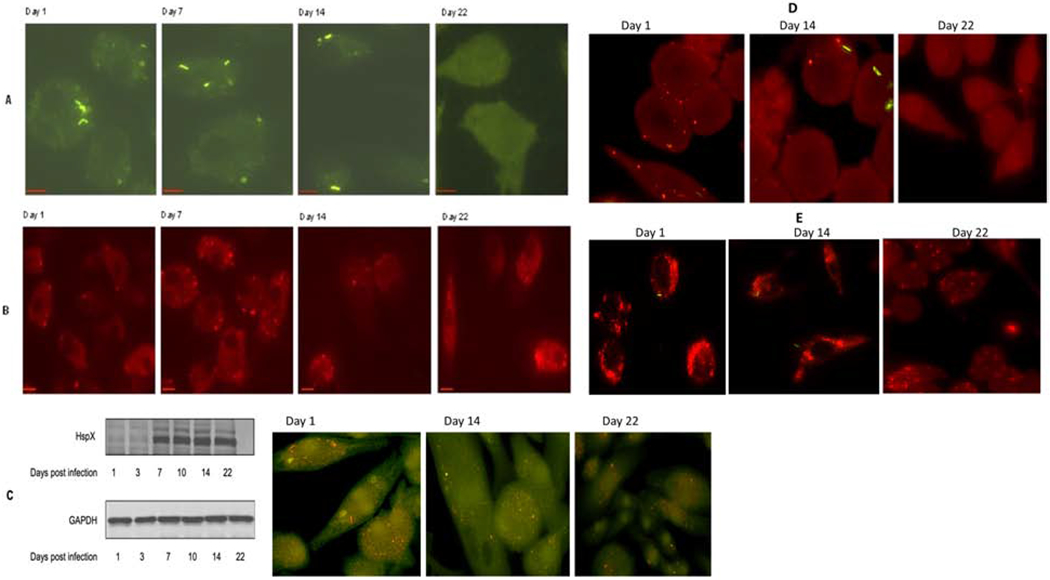
Figure 2.

M. tuberculosis undergoes time-dependent changes in morphology and metabolic activity in response to incubation in MSCs. (A) Fluorescent images of GFP-labeled M. tuberculosis within human MSCs at the indicated time points post-infection. (B) Time-dependent expression of M. tuberculosis dormancy antigen Rv1734 during its residence within human MSCs. For (A) and (B): MSCs were infected at an MOI of 1:1 for 4 hrs. Time in days post-infection is indicated for all panels. Scale bars in the left corner of each image = 10 μm. Representative microscopy images from at least three independent experiments for each time point are shown. Fluorescent images were deconvolved using Nikon microscope’s NIS-Element AR software. For each time point at least 15 separate high-power fields per sample were evaluated, per 3 experimental replicates. (C) Expression of cell wall-associated M. tuberculosis antigen HspX by western blot and intracellular staining at the indicated time points post infection; GADPH was used as a loading control for western blot. (D) Expression of ESAT-6 protein of M. tuberculosis within MSCs at different time post infection as detected by intracellular staining through fluorescent microscopy. (E) Accumulation of lipid bodies (Red) within MSCs at different time post infection with M. tuberculosis H37rv (Green). At selected time points, LB formation was monitored with Nile red that stains neutral lipids within cells.
