
Figure 1. Enhanced Mycobacterial Uptake and Growth in Atg7–/– Macrophages.
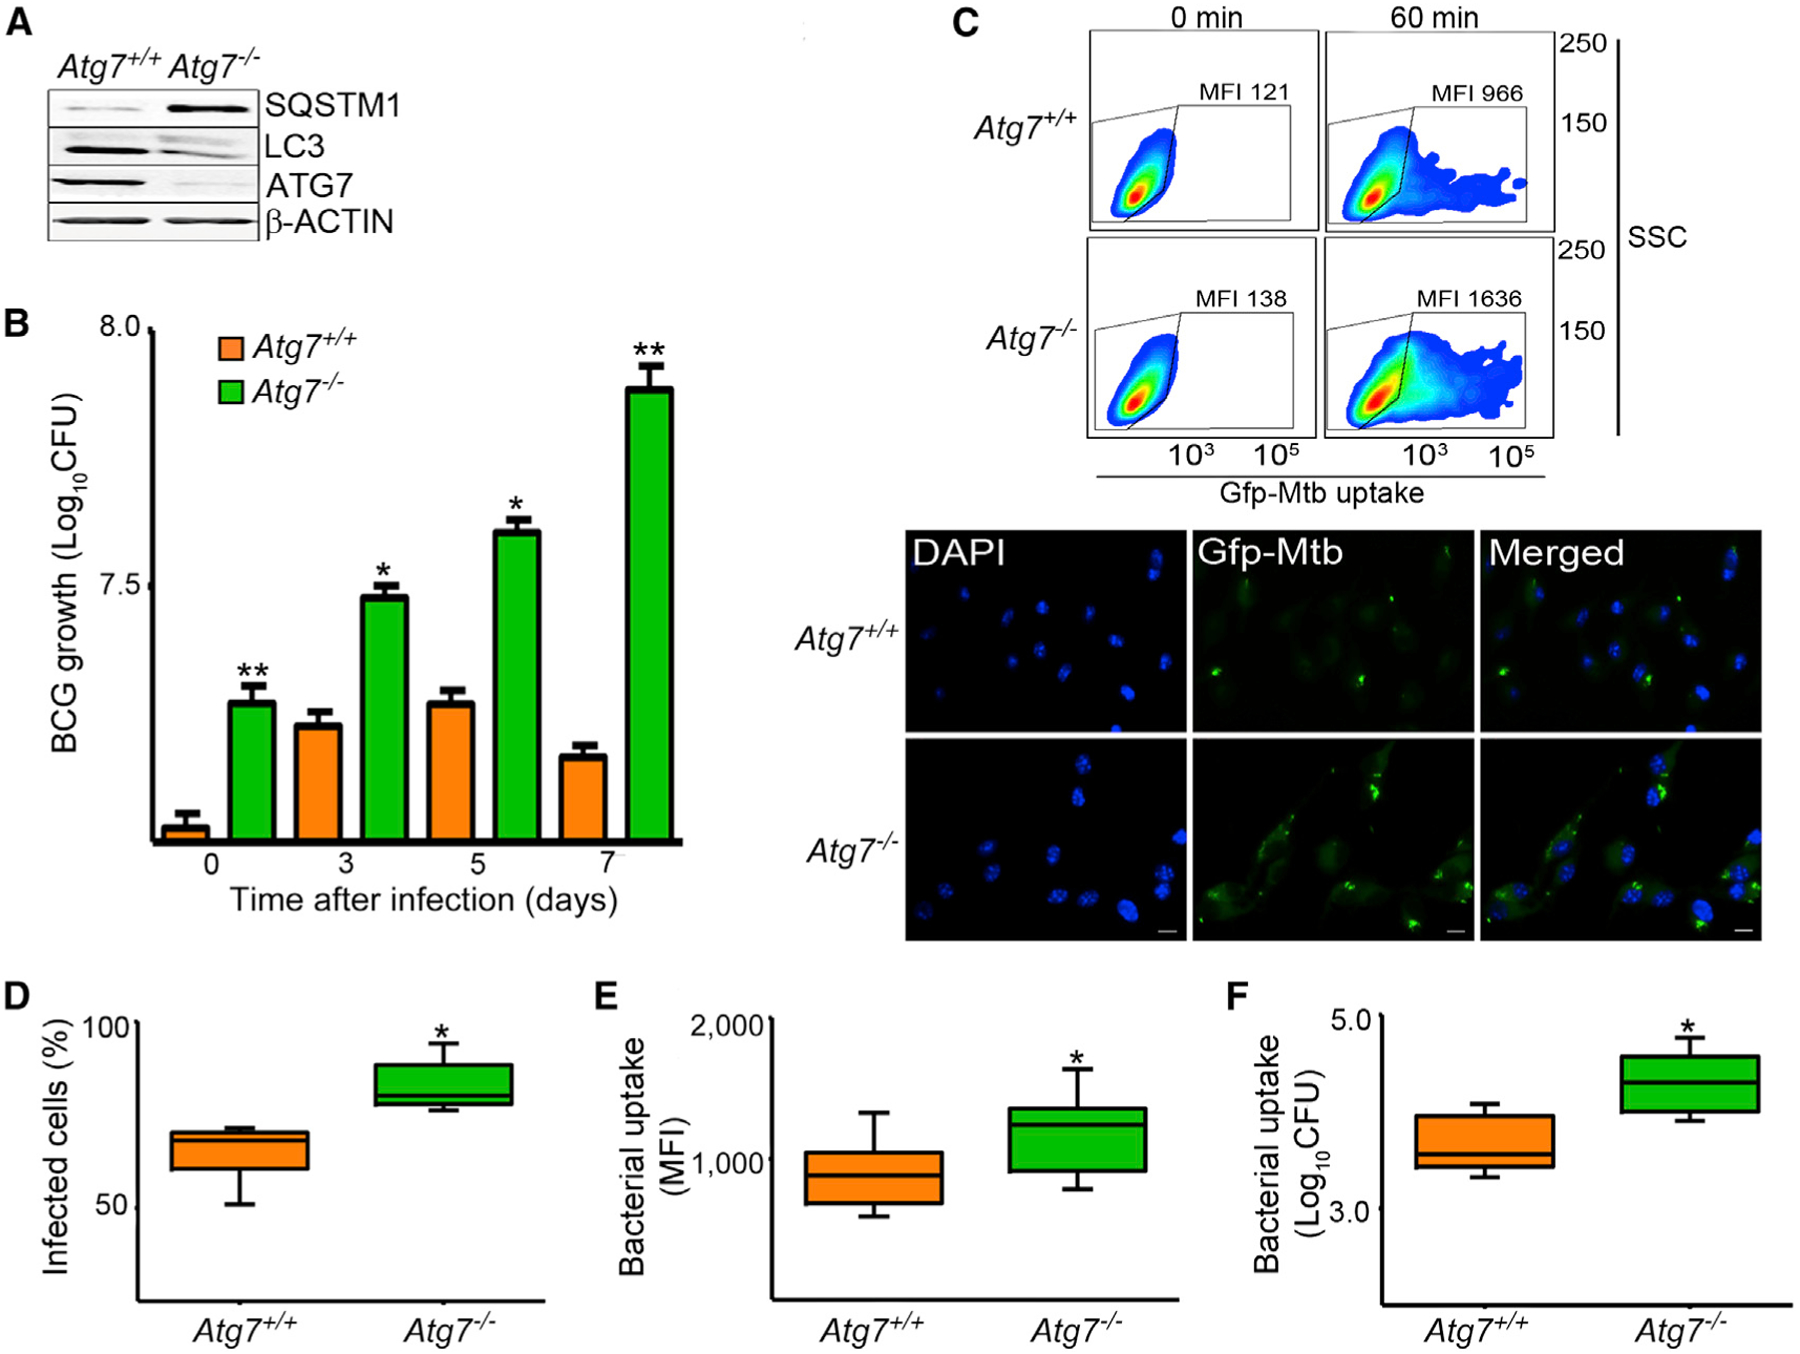
(A) Lysates of BMDMs from Atg7+/+ and Atg7−/− mice were evaluated by immunoblot analysis.(B) BMDMs were infected for 1 hr with BCG at an MOI of 10. Bacterial counts were estimated at 0, 3`, 5, and 7 days by the CFU assay.(C) BMDMs were infected with GFP-expressing H37Rv strain of Mtb (MOI 50) for 60 min. Phagocytic activity was measured by flow cytometry. Representative side scatter (SSC) versus GFP-Mtb dot plots with the corresponding mean fluorescence intensity (MFI) are shown. Mtb uptake was also measured by fluorescence microscopy at 1 hr after infection. DAPI was used to counterstain the nuclei. Scale bars represent 5 μm. Bacterial uptake was evaluated at the end of the 1 hr infection period by determining percent of infected cells (percentage of macrophages containing at least one bacterium). Representative images are shown.(D–F) BMDMs were infected with GFP-expressing Mtb (MOI 50). Bacterial uptake was quantified by fluorescence microscopy (D), flow cytometry (E), and CFU assay (F).
Data are mean ± SD, n = 3; *p < 0.05, **p < 0.001. See also Figure S1.