
Figure 2. Increased Susceptibility to Mycobacterial Infection in Atg7–/– Mice In Vivo.
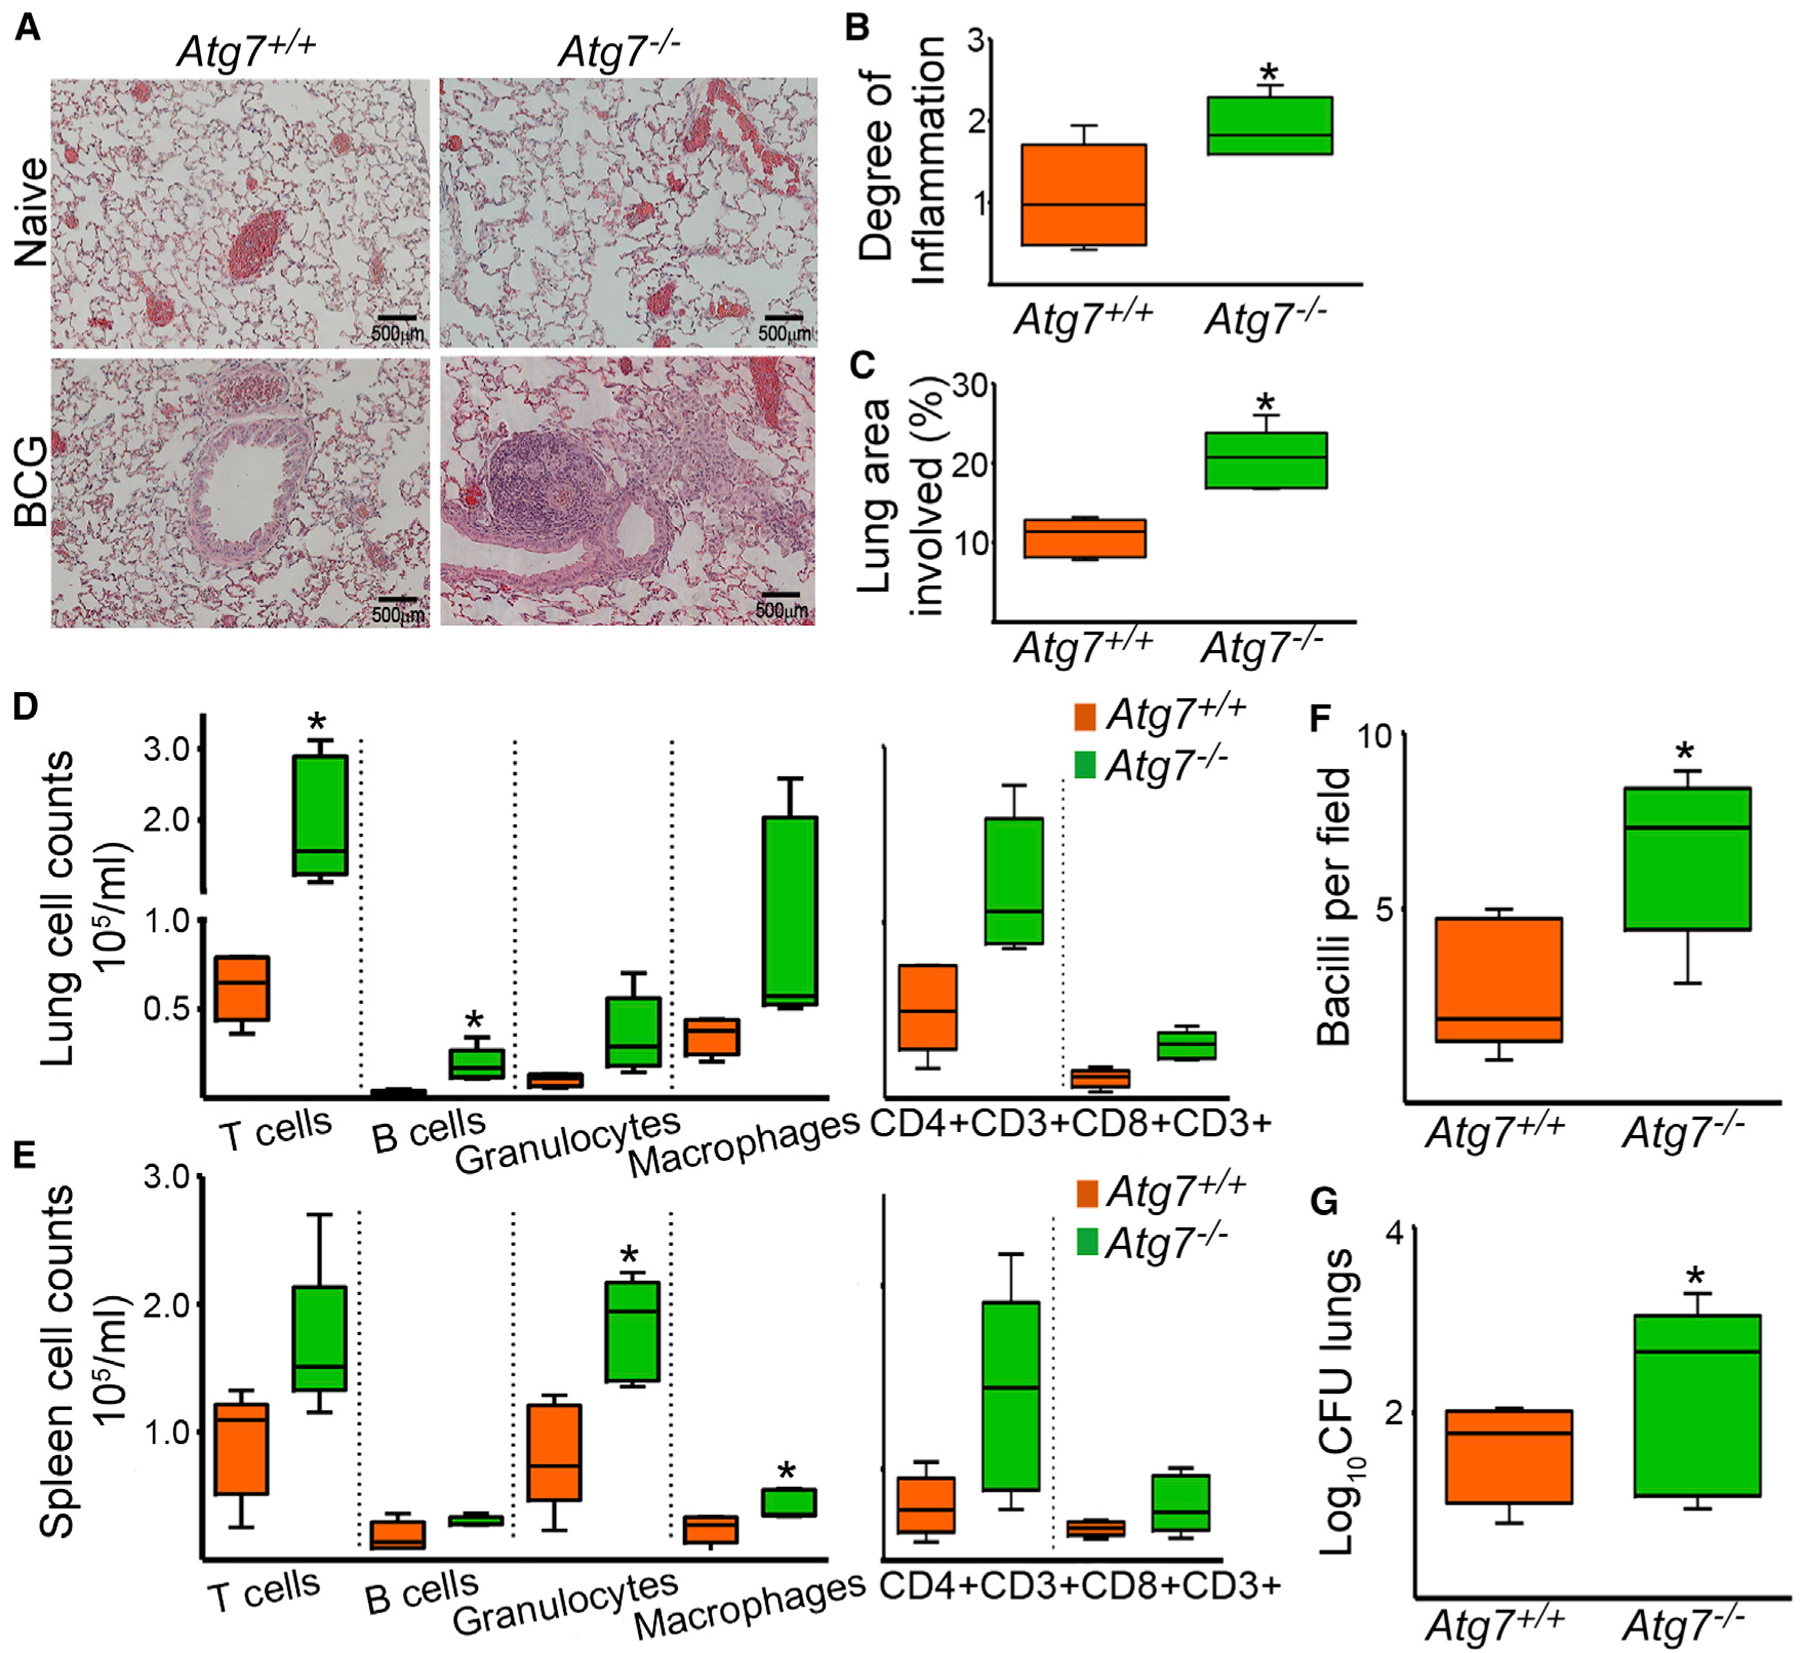
Atg7+/+ and Atg7−/− mice were infected with 1 × 10⁶ BCG intranasally and bacteriological and histopathological changes were evaluated 1 month after infection.(A) Representative lung sections from naive and BCG-infected Atg7−/− and Atg7+/+ mice are shown.(B and C) Degree of lung inflammation was estimated (B), and the percentage of lung involved in the inflammatory response was determined by morphometric analysis (C).(D and E) The cellular composition of the inflammatory infiltrate in lungs (D) and spleens (E) was evaluated by flow cytometry, with conjugated antibodies against CD3+ (T cells), CD4+CD3+ (helper T cells), CD8+CD3+ (cytotoxic T cells), F4/80 (macrophages), Lys6c (granulocytes), or B220 (B cells).(F and G) Number of BCG bacilli in the lung was determined by counting Ziehl-Neelsen-stained bacilli per field of lung section (F) and the number of viable bacteria was estimated by the CFU assay (G). Data expressed as Log10 CFU.
Data are mean ± SD. *p < 0.05. Scale bars represent 500 μm. See also Figure S2.