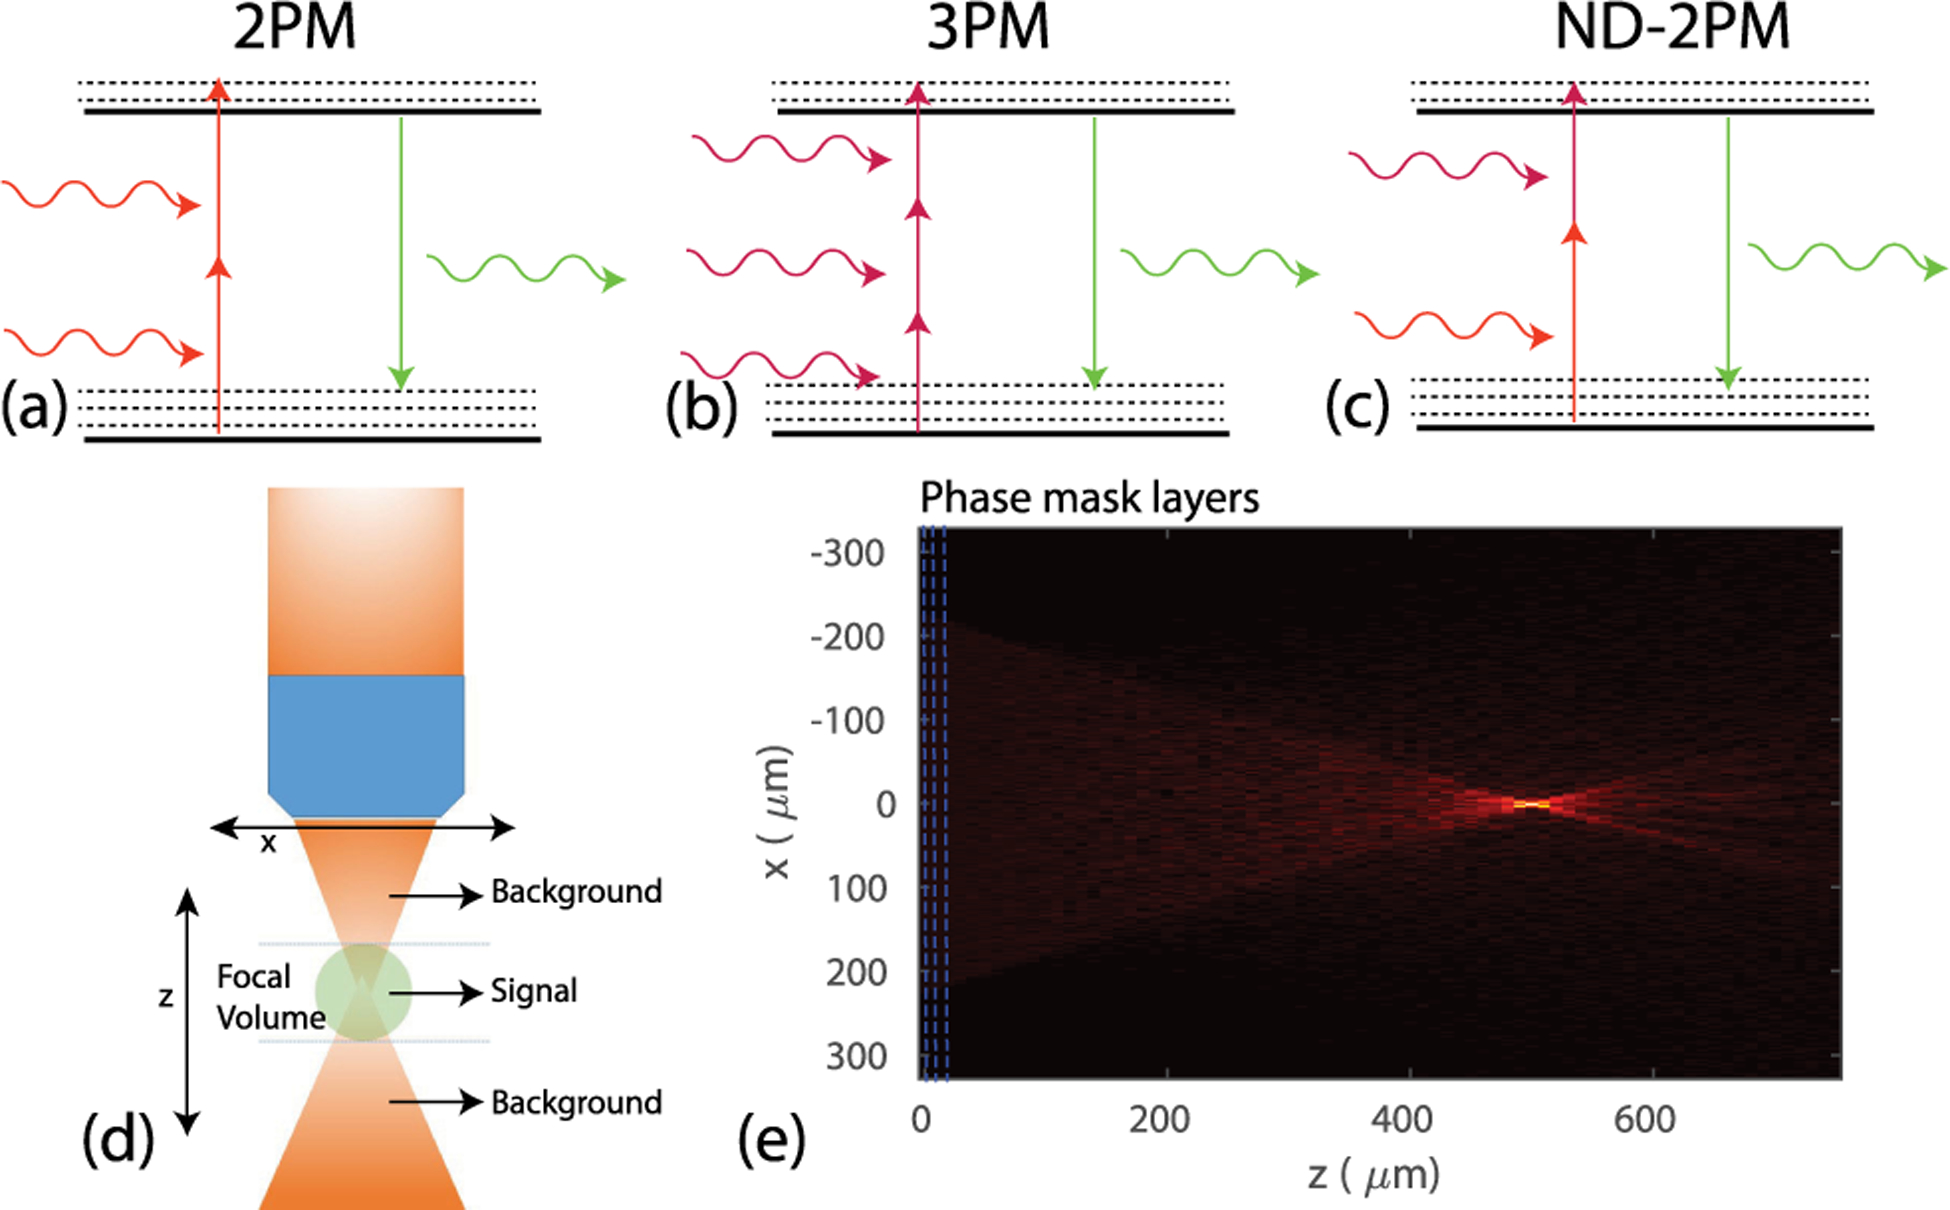
Fig. 1.

Illustration of photon absorption and emission for (a) two-photon microscopy (2PM), (b) three-photon microscopy (3PM), and (c) non-degenerate two-photon microscopy (ND-2PM). (d) Illustration of the calculation of the signal and background fluorescence. The signal is the integrated fluorescence intensity within the depth range containing the focal volume, as defined by the axial width of the PSF. The background fluorescence is the integration within the depths outside of the focal volume. (e) Example of the amplitude distribution of the excitation wave in the xz cross section obtained using our BPM model. Here NA = 0.6, n = 1.33, zf = 500 μm, wavelength λ = 1200 nm, ℓs = 264 μm, and g = 0.9.
