Figure 1.
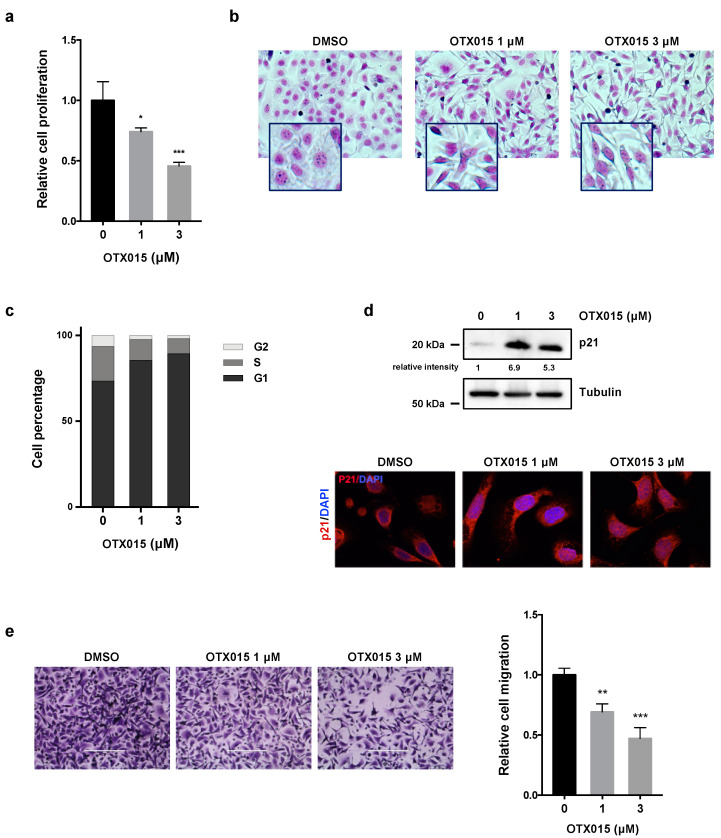
OTX015 influences viability, morphology, proliferation and migration of OC cells. (a) SKOV3 cell proliferation, evaluated by trypan blue exclusion dye at 72 h after OTX015 treatment (1–3 μM), was graphed as fold increase over control (0 μM), set at 1. Results represent mean values ± SD of three independent experiments. Statistical analyses were performed by using one-way ANOVA: * p < 0.05; *** p < 0.001 vs. not-treated cells (b) Cellular morphology, evaluated by Giemsa staining, of SKOV3 cells 72 h after OTX015 exposure at 1 μM or 3 μM concentration. Control cells were treated with DMSO. (c) Flow-cytometry experiments showing cell percentage at G1, S and G2 phases in SKOV3 cells treated for 48 h with OTX015 (0–1–3 μM). Data are average value of two independent experiments. (d) WB assays (upper panel) of p21 protein levels in OTX015-exposed SKOV3 cells (0–1–3 μM). Tubulin served as loading control. IF staining (lower panel) of p21 protein in SKOV3 cells exposed to OTX015 (1 μM and 3 μM). Control cells were treated with DMSO. DAPI was used for nuclear staining. Images were captured under ApoTome microscope at 40× magnification. (e) Cell migration ability in OTX015-exposed SKOV3 cells (1 μM and 3 μM). Representative photos of migrated cells stained with crystal violet (magnification of 20×). Bars are the average values ± SD of migrated cells in two independent experiments, each in triplicate. One-way ANOVA was used for statistics: ** p < 0.01; *** p-value < 0.001 vs. DMSO negative control. The original Western Blot images can be found in Figure S4.

